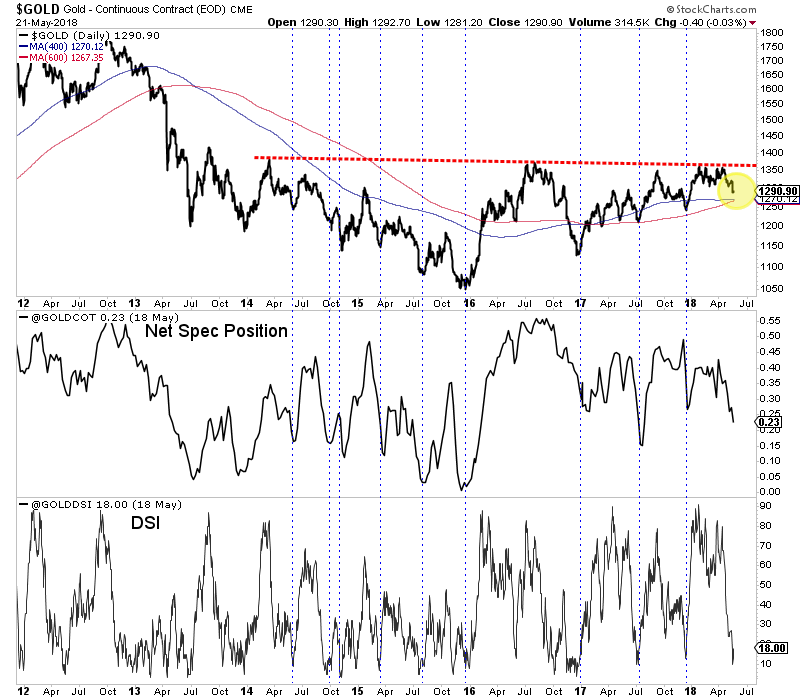
Gold failed to breakout in the spring and recently lost weekly support at $1310. Meanwhile, the gold stocks have held up well in recent weeks (considering Gold) but still have much to prove. Silver couldn’t rally much when its net speculative position was at an all time low. The question now is where do things go from here. The price action is not bullish but with a Fed hike looming and negative sentiment, Gold could be poised to snapback after testing lower levels.
The technicals for Gold show a strong confluence of support at $1265 to $1270. It has traded as low as $1281 in recent days. Trendlines and long-term moving averages coalesce at $1265 to $1270. On the weekly chart, $1265 stands out as a key level. A little bit more selling could bring Gold down to key support.

The sentiment indicators (shown at the bottom of the above chart) are encouraging and would be more so with a test of that aforementioned support. The net speculative position as of last Tuesday hit 22.7% of open interest, which is one of the lowest readings of the past two years. The daily sentiment index hit only 10% bulls last week. It’s 21-day average is 32% bulls and if that fell below 30% it would mark a 9-month low.
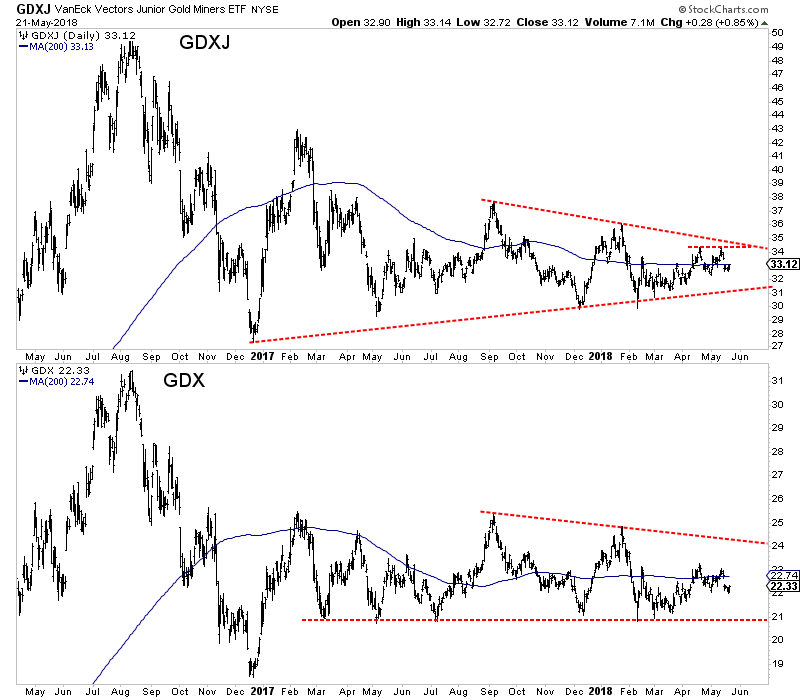
Turning to the miners, we find a sector that continues to be wedged in between support and resistance. GDXJ has trendline and lateral support in the $31s with key resistance in the low $34s. GDX has immediate support at $22 and strong support at $21 while initial resistance is at $23. If Gold is to have another chance to breakout in the months ahead then GDX and GDXJ need to surpass their April highs.

While we are concerned about Gold for the remainder of 2018, it could be setting up for a summer rally and especially if it drops to strong support around $1265. Sentiment would reach even more encouraging levels and that coupled with strong technical support could produce a rebound. In the meantime we continue to focus on and accumulate the juniors that have 300% to 500% return potential over the next 12 to 18 months. To follow our guidance and learn our favorite juniors for the balance of 2018, consider learning more about our premium service.


 Follow us on Twitter
 Become our facebook fan


Comments are closed.