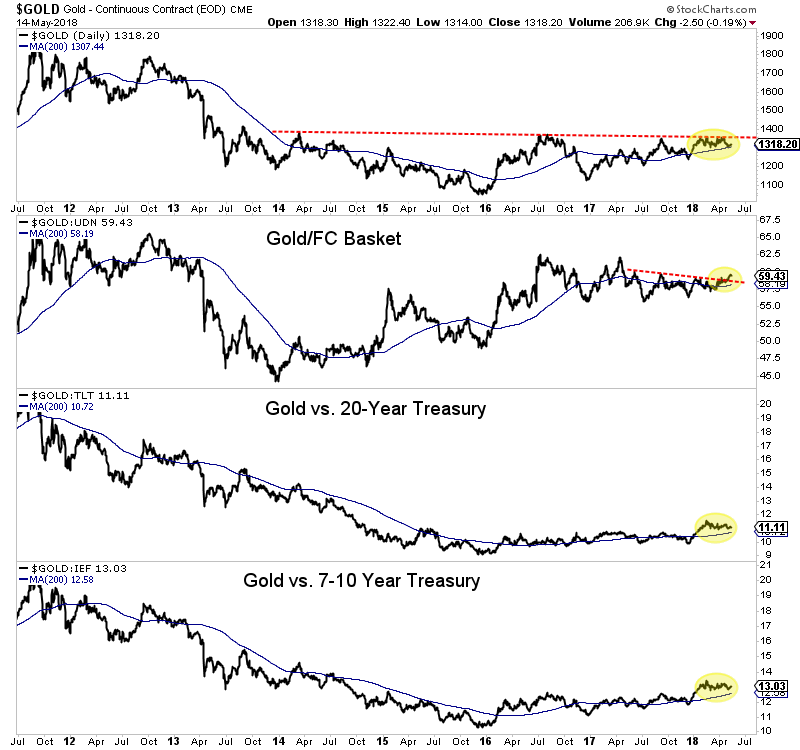
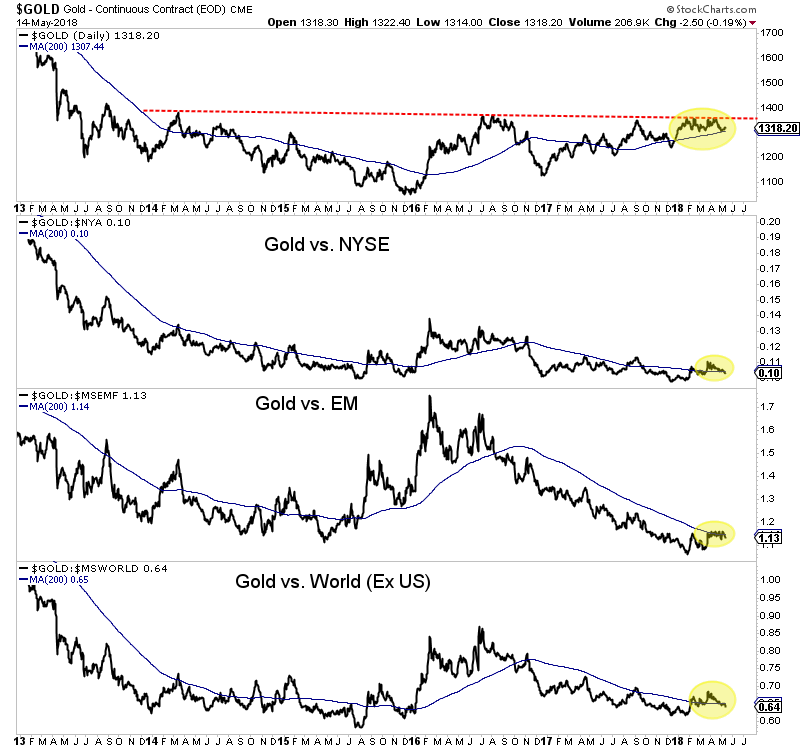
Last week we discussed the fundamentals of Gold, which do not appear bullish at the moment. Real rates (and yields) are rising and investment demand for Gold is flat. That in itself is a temporary but big missing link. However, we are referring to the missing link in the context of intermarket analysis. Gold is an asset that performs best when its outperforming its competitors. That’s true of any asset but especially Gold because it traditionally has been a counter-investment or an anti-investment. While Gold is firmly outperforming Bonds and showing strength against global currencies, it remains neutral to weak against global equities.
First, let’s take a look at Gold relative to foreign currencies (FC) and Bonds. At its 2016 peak, Gold/FC had already retraced the majority of its bear market. Last week Gold/FC managed to close at an 8-month high even as the US$ index rebounded. Gold has performed even better against Bonds and that includes dividends. A few months ago Gold relative to the major Bond ETFs (TLT and IEF) made a 3-year high. Those ratios remain above rising 200-day moving averages.

It’s important for Gold to outperform foreign currencies because if Gold is only rising because of a weak US Dollar that represents a bear market in the dollar rather than a bull market in Gold.
Gold’s outperformance against Bonds is significant because Bonds represent an enormous capital market and Bonds are in some ways the antithesis of Gold.
Unfortunately, Gold has not been able to breakout in nominal terms and from an intermarket perspective, that is because of the strength in the stock market. The ratios below show that Gold relative to global equities is trading not too far above the 2015 lows. If these ratios retested their 2015 lows they’d be trading around 10-year lows!

Gold vs. global equities
Gold appears to have lost the 200-day moving average relative to global equity markets but if it can maintain its outperformance against Bonds and foreign currencies then it will be setup for a powerful move when it can break to the upside relative to equities. The negative is that change does not appear imminent but the positive is when it happens Gold should begin a major leg higher. In the meantime, we continue to focus on and accumulate the juniors that have 300% to 500% return potential over the next 12 to 18 months. To follow our guidance and learn our favorite juniors for the balance of 2018, consider learning more about our premium service.
If you would like to receive our free newsletter via email, simply enter your email address below & click subscribe.
CONNECT WITH US
Tweets
Tweet with hash tag #miningfeeds or @miningfeeds and your tweets will be displayed across this site.
MOST ACTIVE MINING STOCKS
Daily Gainers
 Amarc Resources Ltd. Amarc Resources Ltd. |
AHR.V | +171.70% |
        |
FYL.V | +125.00% |
    |
EDE.AX | +100.00% |
        |
RG.V | +50.00% |
    |
CTO.AX | +33.33% |
        |
CASA.V | +30.00% |
    |
AGD.AX | +26.32% |
        |
CVB.V | +25.93% |
        |
CMB.V | +25.00% |
        |
RKR.V | +25.00% |
Articles
FOUND POSTS
Indonesia Sets 2025 Nickel Ore Mining Quota at 200 Million Tons
January 15, 2025


 Follow us on Twitter
 Become our facebook fan


