Vancouver, British Columbia–(Newsfile Corp. – April 12, 2021) – Lara Exploration Ltd. (TSXV: LRA) ("Lara" or "the Company"), is pleased to report that it has completed a reappraisal of the diamond drilling and ground magnetometer survey results for its Itaítuba vanadium project, in the Tapajós region of northern Brazil. Project work initially focused on vanadium-bearing magnetite bodies, but the recent work has shown that the host gabbros also contain disseminated vanadium-bearing magnetite that can be concentrated to enrich the vanadium grade. Surface mapping and the magnetic survey show these gabbros to be extensive within the Lara property and the Company plans to undertake further geophysical surveys and follow-up drilling later in the year.
Half core samples from four scout holes were subjected to Davis Tube Recovery ("DTR") testing and the resulting magnetic concentrates then assayed for vanadium pentoxide ("V2O5"). In the fresh rock sections of three of the holes (holes SR-02, SR-03 and SR-04), significant intervals were identified, where the magnetite concentrate recovery values are in the order of 10 to 20% of the original core sample mass. In two of these holes (SR-03 and SR-04) the V2O5 grades for these concentrates are in the order of 0.8% to 1.1% (see table below). The hole SR-04 has the thickest interval of 47.65m and is still open to depth. The down hole intervals are assumed to be approximately true width, based on the surface mapping information and the drill core logging.
|
DRILL HOLE |
E-UTM |
N-UTM |
From (m) |
To (m) |
Width (m) |
DTR (%) |
V2O5 in concentrate (%) |
|
SR-01 |
624356 |
9500481 |
No significant results |
||||
|
SR-02 |
624569 |
9500559 |
70.90 |
75.35 |
4.45 |
20.75 |
0.64 |
|
SR-03 |
624463 |
9500378 |
24.03 |
41.80 |
17.77 |
17.34 |
0.83 |
|
SR-04 |
624362 |
9500104 |
25.70 |
73.35 |
47.65 |
11.02 |
0.91 |
|
incl |
51.40 |
55.75 |
4.35 |
15.56 |
1.08 |
||
|
and |
66.35 |
71.85 |
5.50 |
14.49 |
1.15 |
||
No significant vanadium enrichment was detected in the magnetic concentrates in the weathered saprolite upper parts of any of the four drill holes. The core logging indicates that the vanadium enriched zones are associated with intercalated units of magnetite-olivine-gabbro and ferro-gabbro. Contacts observed in the cores indicate a sub-horizontal or gently west-dipping attitude for these units consistent with the dips of the overlying massive magnetite bodies.
Review of ground magnetic data indicates that drill hole SR-04 is located central to a large anomaly in the order of 700m (E-W) by 300m to 400m (N-S), at the southern end of the complex, indicating the possibility that the vanadium-bearing disseminated magnetite units could have a large horizontal extent in this southern part of the complex (see Figure 1. below). Holes SR-02 and SR-03, which reported narrower and lower grade vanadium pentoxide intersections, are both located in a similar-sized magnetic anomaly immediately to the north of the SR-04 zone and other strong magnetic anomaly zones are present along the northward extension for a further 2,000m along the main ridge. Surface geological mapping suggests that the entire ridge is underlain by the gabbro complex.

Figure 1
To view an enhanced version of this graphic, please visit:
https://orders.newsfilecorp.com/files/2373/79965_picture1.jpg
Further work is planned, including extensions to the original ground magnetics survey, geological mapping with the objective to identify the more magnetite-rich ferro-gabbro phases within the complex, and drill testing of the priority target unit already identified at the southern end of the complex, as well as scout drilling at other priority magnetic zones in the central and northern parts of the complex.
Background
Work at the Itaítuba project initially focused on outcropping massive vanadium and titanium bearing magnetite bodies, hosted in a gabbro complex, as a possible direct shipping ore. The surface rock chip sampling indicated that the magnetites contained between 21% and 24% titanium dioxide ("TiO2") and from 0.35 to 0.5% V2O5 (see Lara news release of April 17th, 2012).
Surface geological mapping and the scout drilling of four shallow holes, from 35m to 75m in depth, located in the southern end of the host gabbro complex, show that these magnetite bodies are flat sheet-like bodies from 2m to 8m thick with a shallow westerly dip. The early Quemscan and Davis Tube Recovery testing on selected surface samples suggested that it would not be possible to obtain a concentrate of any better vanadium grade because the titanium and vanadium are both contained within the magnetite crystal structure (see Lara news release of February 11th, 2014).
Logging of the drill core indicated that the massive magnetites are hosted by a multi-phase system of different gabbro intrusives, some of which are extremely enriched in disseminated magnetite (ferro-gabbros). Initial sampling of a few short intervals of these magnetite-rich gabbro phases indicated that it was possible to obtain a magnetite concentrate from some of the samples of between 6.6% and 42.6% of the original sample weight and that these concentrates analyzed V2O5 grades from 0.32 % up to 1.03% V2O5 with enrichment factors up to 10.8 times the vanadium pentoxide values in the core samples (see Lara news release of February 26th, 2019).
Sampling methodology, Chain of Custody, Quality Assurance and Quality Control
All the rock channel and drill core sampling were carried out by or under the supervision of the Company's Vice-President Exploration and the chain of custody of the samples and drill core from the project area to the Company's sample preparation facilities in Itaituba and Canãa dos Carajás was continuously monitored.
Sample intervals for the drill core samples varied between 0.2m and 3.0m. The core samples were delivered to the sample preparation laboratories of SGS-Geosol in Parauapebas and to ALS in Goiânia where the samples were crushed and pulverized. SGS-Geosol dispatched sample pulps to their own analytical laboratory at Vespasiano, near Belo Horizonte, Minas Gerais State, Brazil, whereas ALS dispatched the pulps to their dedicated facility in Loughrea, Ireland.
Davis Tube Recovery magnetic concentrates were obtained for each sample, using a magnetic field force of 3000 Gauss and the concentrates, after drying and weighing to determine the percentage of magnetic iron concentrate recovery, were analyzed by XRF for V2O5, TiO2, Fe2O3 and seven other oxides after fusion with lithium tetraborate and for Loss on Ignition, which was determined by heating the sample in a furnace at 405 degrees centigrade.
Both SGS-Geosol and ALS inserted blank, certified standard and duplicate samples into each sample batch. Both laboratories are independent from Lara.
Michael Bennell, Lara's Vice President Exploration and a Fellow of the Australasian Institute of Mining and Metallurgy (AusIMM), is a Qualified Person as defined by National Instrument 43-101 Standards of Disclosure for Mineral Projects and has approved the technical disclosure and verified the technical information in this news release.
About Lara Exploration
Lara is an exploration company following the Prospect and Royalty Generator business model, which aims to minimize shareholder dilution and financial risk by generating prospects and exploring them in joint ventures funded by partners, retaining a minority interest and or a royalty. The Company currently holds a diverse portfolio of prospects, deposits and royalties in Brazil, Peru and Chile. Lara's common shares trade on the TSX Venture Exchange under the symbol "LRA".
For further information on Lara Exploration Ltd. please consult our website www.laraexploration.com, or contact Chris MacIntyre, VP Corporate Development, at +1 416 703 0010.
Neither the TSX Venture Exchange nor the Investment Industry Regulatory Organization of Canada accepts responsibility for the adequacy or accuracy of this release.
-30-
To view the source version of this press release, please visit https://www.newsfilecorp.com/release/79965
Today we will run through one way of estimating the intrinsic value of Aurelia Metals Limited (ASX:AMI) by taking the forecast future cash flows of the company and discounting them back to today's value. We will take advantage of the Discounted Cash Flow (DCF) model for this purpose. Models like these may appear beyond the comprehension of a lay person, but they're fairly easy to follow.
Companies can be valued in a lot of ways, so we would point out that a DCF is not perfect for every situation. If you want to learn more about discounted cash flow, the rationale behind this calculation can be read in detail in the Simply Wall St analysis model.
See our latest analysis for Aurelia Metals
The calculation
We are going to use a two-stage DCF model, which, as the name states, takes into account two stages of growth. The first stage is generally a higher growth period which levels off heading towards the terminal value, captured in the second 'steady growth' period. To begin with, we have to get estimates of the next ten years of cash flows. Where possible we use analyst estimates, but when these aren't available we extrapolate the previous free cash flow (FCF) from the last estimate or reported value. We assume companies with shrinking free cash flow will slow their rate of shrinkage, and that companies with growing free cash flow will see their growth rate slow, over this period. We do this to reflect that growth tends to slow more in the early years than it does in later years.
Generally we assume that a dollar today is more valuable than a dollar in the future, so we need to discount the sum of these future cash flows to arrive at a present value estimate:
10-year free cash flow (FCF) estimate
|
2021 |
2022 |
2023 |
2024 |
2025 |
2026 |
2027 |
2028 |
2029 |
2030 |
|
|
Levered FCF (A$, Millions) |
-AU$139.0m |
AU$125.0m |
AU$61.0m |
AU$76.0m |
AU$91.0m |
AU$85.3m |
AU$82.0m |
AU$80.3m |
AU$79.7m |
AU$79.7m |
|
Growth Rate Estimate Source |
Analyst x1 |
Analyst x1 |
Analyst x1 |
Analyst x1 |
Analyst x1 |
Est @ -6.29% |
Est @ -3.8% |
Est @ -2.06% |
Est @ -0.84% |
Est @ 0.02% |
|
Present Value (A$, Millions) Discounted @ 7.8% |
-AU$129 |
AU$108 |
AU$48.7 |
AU$56.3 |
AU$62.5 |
AU$54.4 |
AU$48.5 |
AU$44.1 |
AU$40.6 |
AU$37.6 |
("Est" = FCF growth rate estimated by Simply Wall St)
Present Value of 10-year Cash Flow (PVCF) = AU$371m
We now need to calculate the Terminal Value, which accounts for all the future cash flows after this ten year period. The Gordon Growth formula is used to calculate Terminal Value at a future annual growth rate equal to the 5-year average of the 10-year government bond yield of 2.0%. We discount the terminal cash flows to today's value at a cost of equity of 7.8%.
Terminal Value (TV)= FCF2030 × (1 + g) ÷ (r – g) = AU$80m× (1 + 2.0%) ÷ (7.8%– 2.0%) = AU$1.4b
Present Value of Terminal Value (PVTV)= TV / (1 + r)10= AU$1.4b÷ ( 1 + 7.8%)10= AU$664m
The total value, or equity value, is then the sum of the present value of the future cash flows, which in this case is AU$1.0b. To get the intrinsic value per share, we divide this by the total number of shares outstanding. Compared to the current share price of AU$0.4, the company appears quite undervalued at a 49% discount to where the stock price trades currently. The assumptions in any calculation have a big impact on the valuation, so it is better to view this as a rough estimate, not precise down to the last cent.

Important assumptions
We would point out that the most important inputs to a discounted cash flow are the discount rate and of course the actual cash flows. Part of investing is coming up with your own evaluation of a company's future performance, so try the calculation yourself and check your own assumptions. The DCF also does not consider the possible cyclicality of an industry, or a company's future capital requirements, so it does not give a full picture of a company's potential performance. Given that we are looking at Aurelia Metals as potential shareholders, the cost of equity is used as the discount rate, rather than the cost of capital (or weighted average cost of capital, WACC) which accounts for debt. In this calculation we've used 7.8%, which is based on a levered beta of 1.106. Beta is a measure of a stock's volatility, compared to the market as a whole. We get our beta from the industry average beta of globally comparable companies, with an imposed limit between 0.8 and 2.0, which is a reasonable range for a stable business.
Moving On:
Although the valuation of a company is important, it shouldn't be the only metric you look at when researching a company. It's not possible to obtain a foolproof valuation with a DCF model. Preferably you'd apply different cases and assumptions and see how they would impact the company's valuation. For instance, if the terminal value growth rate is adjusted slightly, it can dramatically alter the overall result. What is the reason for the share price sitting below the intrinsic value? For Aurelia Metals, there are three pertinent aspects you should explore:
-
Risks: To that end, you should be aware of the 3 warning signs we've spotted with Aurelia Metals .
-
Future Earnings: How does AMI's growth rate compare to its peers and the wider market? Dig deeper into the analyst consensus number for the upcoming years by interacting with our free analyst growth expectation chart.
-
Other Solid Businesses: Low debt, high returns on equity and good past performance are fundamental to a strong business. Why not explore our interactive list of stocks with solid business fundamentals to see if there are other companies you may not have considered!
PS. Simply Wall St updates its DCF calculation for every Australian stock every day, so if you want to find the intrinsic value of any other stock just search here.
This article by Simply Wall St is general in nature. It does not constitute a recommendation to buy or sell any stock, and does not take account of your objectives, or your financial situation. We aim to bring you long-term focused analysis driven by fundamental data. Note that our analysis may not factor in the latest price-sensitive company announcements or qualitative material. Simply Wall St has no position in any stocks mentioned.
Have feedback on this article? Concerned about the content? Get in touch with us directly. Alternatively, email editorial-team (at) simplywallst.com.
VANCOUVER, British Columbia, April 12, 2021 (GLOBE NEWSWIRE) — Aton Resources Inc. (AAN: TSX-V) ("Aton" or the "Corporation") announces that it has agreed to settle a total of CAD$116,348.49 in debt (the “Debt”) to directors and employees in exchange for 484,785 common shares (the “Shares”) at a price of $0.24 per Share (the “Shares for Debt”).
Bill Koutsouras, Aton’s Interim CEO & Chairman of the Board stated, “I would like to thank the directors and employees who have opted to receive amounts payable to them in Shares. This is a show of confidence in Aton as we continue to move forward aggressively with plans to recommence drilling on our projects”.
The Shares for Debt transaction is subject to the approval of the TSX Venture Exchange. All Shares issued will be subject to a four-month hold period. No new control person will be created as a result of the Shares for Debt transactions.
|
About Aton Resources Inc. Aton Resources Inc. (AAN: TSX-V) is focused on its 100% owned Abu Marawat Concession (“Abu Marawat”), located in Egypt’s Arabian-Nubian Shield, approximately 200 km north of Centamin’s world-class Sukari gold mine. Aton has identified numerous gold and base metal exploration targets at Abu Marawat, including the Hamama deposit in the west, the Abu Marawat deposit in the northeast, and the advanced Rodruin exploration prospect in the south of the Concession. Two historic British gold mines are also located on the Concession at Sir Bakis and Semna. Aton has identified several distinct geological trends within Abu Marawat, which display potential for the development of a variety of styles of precious and base metal mineralisation. Abu Marawat is 447.7 km2 in size and is located in an area of excellent infrastructure; a four-lane highway, a 220kV power line, and a water pipeline are in close proximity, as are the international airports at Hurghada and Luxor. For further information regarding Aton Resources Inc., please visit us at www.atonresources.com or contact: BILL KOUTSOURAS Interim CEO |
|
Note Regarding Forward-Looking Statements Some of the statements contained in this release are forward-looking statements. Since forward-looking statements address future events and conditions; by their very nature they involve inherent risks and uncertainties. Actual results in each case could differ materially from those currently anticipated in such statements. Neither TSX Venture Exchange nor its Regulation Services Provider (as that term is defined in policies of the TSX Venture Exchange) accepts responsibility for the adequacy or accuracy of this release. |
VANCOUVER, British Columbia, April 12, 2021 (GLOBE NEWSWIRE) — Silver Bull Resources, Inc. (TSX: SVB, OTCQB: SVBL) (“Silver Bull” or the “Company”) today announced that it is postponing its 2021 annual meeting of shareholders (the “Meeting”) to April 19, 2021 to provide its shareholders with additional time to vote on the proposals submitted for shareholder approval at the Meeting. Shareholders are advised that because one of the proposals involves proposed amendments to the Company’s articles of incorporation, the holders of a majority of the outstanding shares of Silver Bull common stock must approve such proposal.
The record date for determining the shareholders eligible to vote at the Meeting will remain the close of business on February 18, 2021. Shareholders who have already submitted a proxy do not need to vote again for the postponed Meeting rescheduled for Monday, April 19, 2021 at 10:00 a.m. Pacific time at the Company’s offices at 777 Dunsmuir Street, Suite 1610, Vancouver, British Columbia, as the proxies submitted will remain valid.
Of particular importance, the Company’s board of directors strongly recommends that all shareholders to vote “FOR” the proposal to increase the number of authorized shares. In the absence of an affirmative vote to increase the number of authorized shares of Silver Bull common stock, the Company will have virtually no shares available for issuance to raise funds to fund general corporate overhead or cover the costs associated with maintaining its mining interests, including in the Sierra Mojada project in Mexico.
Silver Bull shareholders as of close of business on February 18, 2021 who have not voted are encouraged to vote online at www.proxyvote.com or by telephone at 1-800-690-6903. The proxy voting deadline to vote by Internet or telephone is April 18, 2021 at 11:59 p.m. Eastern time. Silver Bull shareholders who require assistance with voting their shares or have questions may contact the Company by email at info@silverbullresources.com.
Shareholders who have already submitted proxies and want to change their proxy can update their vote at any time before the votes are cast at the Meeting. Your vote will be recorded at the Meeting in accordance with your most recently submitted proxy.
Important Information
This communication may be deemed to be solicitation material in connection with the proposals to be considered at the Meeting. In connection with the proposals, Silver Bull filed a definitive proxy statement on Schedule 14A with the U.S. Securities and Exchange Commission (the “SEC”) on February 23, 2021. Shareholders are urged to read the definitive proxy statement and all other relevant documents filed with the SEC because they contain important information about the proposals. An electronic copy of the definitive proxy statement is available on the Company’s website at www.silverbullresources.com, on the Company’s EDGAR profile at www.sec.gov, and on its SEDAR profile at www.sedar.com.
Participants in the Solicitation
Silver Bull and its directors and executive officers may be deemed to be participants in the solicitation of proxies from Silver Bull shareholders in respect of the proposals to be considered at the Meeting. Information about the directors and executive officers of Silver Bull can be found in its Annual Report on Form 10-K for the year ended October 31, 2020 filed with the SEC on January 28, 2021, filings on Form 3, 4 and 5 filed with the SEC, and the Company’s definitive proxy statement for the Meeting filed with the SEC on February 23, 2021.
About Silver Bull
Silver Bull is a Vancouver-based mineral exploration company whose shares are listed on the TSX and trade on the OTCQB in the United States. Silver Bull owns the Sierra Mojada Project which is located 150 kilometers north of the city of Torreon in Coahuila, Mexico, and is highly prospective for silver and zinc. Sierra Mojada is currently under a joint venture option with South32 International Investment Holdings Pty Ltd. In addition, Silver Bull’s subsidiary, Arras Minerals Corp. holds an Option Agreement to acquire the Beskauga Copper-Gold Project, located in North Eastern Kazakhstan.
On behalf of the Board of Directors
“Tim Barry”
Tim Barry, CPAusIMM
Chief Executive Officer, President and Director
INVESTOR RELATIONS:
+1 604 687 5800
info@silverbullresources.com
Cautionary note regarding forward looking statements: Certain statements in this news release are “forward-looking” within the meaning of applicable securities legislation. Forward-looking statements can generally be identified by the use of forward-looking terminology such as “may”, “will”, “expect”, “intend”, “estimate”, “anticipate”, “believe”, “continue”, “plans” or similar terminology. Forward-looking statements include, but are not limited to, statements relating to the proposals to be considered at the Meeting. Forward-looking statements are necessarily based upon the current belief, opinions and expectations of management that, while considered reasonable by the Company, are inherently subject to significant business, economic, competitive, political and social uncertainties and other contingencies. Many factors could cause the Company’s actual results to differ materially from those expressed or implied in the forward-looking statements. These factors include, among others, market prices, metal prices, availability of capital and financing, general economic, market or business conditions, as well as other risk factors set out under the heading “Risk Factors” in the Annual Report on Form 10-K for the year ended October 31, 2020, which is available on SEDAR at www.sedar.com. Investors are cautioned not to put undue reliance on forward-looking statements due to the inherent uncertainty therein.
NOT FOR DISSEMINATION IN THE UNITED STATES OF AMERICA OR TO US WIRE SERVICES
-
Experienced public company CFO joins Rogue management team
-
In February-March Rogue Stone sold 3,313 tons realizing an average price of $74/ton
-
Average value of limestone sold rises as expected with increased demand for higher value products
TORONTO, ON / ACCESSWIRE / April 12, 2021 / Rogue Resources Inc. (TSX-V:RRS) ("Rogue" or the "Company") is pleased to announce the appointment of Mr. Travis Gingras as Chief Financial Officer ("CFO") of the Company. Mr. Gingras will replace Sean Samson, who has recently acted as Interim CFO.
Travis Gingras is a CPA, CMA and holds an MBA. He has more than twenty years of experience in finance, strategic planning, project management, accounting policy and financial reporting. Travis previously held CFO and executive level positions in a number of publicly traded exploration and mining companies including as CFO of Integra Gold Corp (formerly TSXV:ICG, purchased by Eldorado Gold in 2017).
"It's great to welcome Travis as CFO", said Sean Samson, President and CEO of Rogue. "Travis has a proven track record of sound leadership and financial expertise with public companies and we look forward to him joining the team."
Rogue Stone – February and March Update
Quarry Operations at the Orillia Quarry have continued through the winter and early spring with strong demand for Rogue's limestone products. During the months of February and March, the Company sold a total of 3,313 tons of limestone for gross revenue of $244,235 and are in line with the sales expectations following the closing of the 3rd quarter on January 31, 2021. Rogue Stone also observed the expected increase in the value of the limestone sold as the demand for the higher value limestone products, including steps, wall stone and flagstone, begins to pick up with the arrival of spring and the warmer weather.
|
Period |
Tons |
Average Realized Revenue per ton sold |
Average Cost of Goods ("COGS") per ton sold |
|
Q3-2021 November 2020 – January 2021 |
6,914 |
$70 |
$37 |
|
February – March |
3,313 |
$74 |
To be announced with Q4-2021 results |
"As we approach our first full year of operations with both quarries, we are pleased to see that the demand and sales of limestone are continuing to meet or exceed expectations.", said Sean Samson, President and CEO of Rogue. "We anticipate that our sales will continue to increase through the spring and summer with rising revenue per ton sold as our sales mix shifts to more high value products."
About Rogue Resources Inc.
Rogue is a mining company focused on generating positive cash flow. Not tied to any commodity, it looks at rock value and quality deposits that can withstand all stages of the commodity price cycle. The Company includes Rogue Stone selling quarried limestone for landscape applications from two operating quarries in Ontario; Rogue Quartz focused on advancing its silica/quartz business with the Snow White Project in Ontario and the Silicon Ridge Project in Québec; Rogue Timmins with the gold potential at Radio Hill and an ownership position in the private company EV Nickel, exploring in the Shaw Dome.
Qualified Person
The Company's Projects are under the direct technical supervision of Paul Davis, P.Geo., and Vice-President of the Company. Mr. Davis is a Qualified Person as defined by NI 43-101. He has reviewed and approved the technical information in this press release. There are no known factors that could materially affect the reliability of the information verified by Mr. Davis.
For more information visit www.rogueresources.ca or contact:
+1-647-243-6581
info@rogueresources.ca
Cautionary Note Regarding Forward-Looking Statements:
This news release contains certain statements or disclosures relating to the Company that are based on the expectations of its management as well as assumptions made by and information currently available to the Company which may constitute forward-looking statements or information ("forward-looking statements") under applicable securities laws. Forward-looking statements are statements that are not historical facts and are generally, but not always, identified by the words "believes", "anticipates", "expects", "plans", "intends", "target", "estimates", "projects", "continue", "potential" and similar expressions, or are events or conditions that "will", "would", "may", "could" or "should" occur or be achieved. In particular, but without limiting the foregoing, this news release contains forward-looking statements pertaining to the following: closing of future tranches of the Private Placement.
The forward-looking statements contained in this news release reflect several material factors and expectations and assumptions of the Company including, without limitation: business strategies and the environment in which the Company will operate in the future; commodity prices; exploration and development costs; mining operations, drilling plans and access to available goods and services and development parameters; regulatory restrictions; the ability of the Company to obtain applicable permits; the ability of the Company to service its debt obligations; the Company's ability to qualify for government funded support programs; the Company's ability to raise capital on terms acceptable to it or at all; activities of governmental authorities (including changes in taxation and regulation); currency fluctuations; the unpredictable economic impact of the COVID-19 pandemic, including the acquisition of equipment and recruitment of human resources required for the sales expansion; the global economic climate; and competition.
The Company believes that the material factors, expectations and assumptions reflected in the forward-looking statements contained in this news release are reasonable at this time but no assurance can be given that these factors, expectations and assumptions will prove to be correct. The forward-looking statements included in this news release are not guarantees of future performance and should not be unduly relied upon. Such forward-looking statements involve known and unknown risks, uncertainties and other factors that may cause actual results or events to differ materially from those anticipated in such forward-looking statements including, without limitation, those risks identified in the Company's most recent annual and interim management's discussion and analysis, copies of which are available on the Company's SEDAR profile at www.sedar.com. Readers are cautioned that the foregoing list of factors is not exhaustive and are cautioned not to place undue reliance on these forward-looking statements.
The forward-looking statements contained in this news release are made as of the date hereof and the Company undertakes no obligations to update publicly or revise any forward-looking statements, whether as a result of new information, future events or otherwise, unless so required by applicable securities laws. This news release does not constitute an offer to sell or a solicitation of an offer to buy any securities in the United States of America. The securities have not been and will not be registered under the United States Securities Act of 1933 (the "U.S. Securities Act") or any state securities laws and may not be offered or sold within the United States or to U.S. Persons (as defined in the U.S. Securities Act) unless registered under the U.S. Securities Act and applicable state securities laws, or an exemption from such registration is available.
Neither the TSXV nor its Regulation Services Provider (as that term is defined in the policies of the TSXV) accepts responsibility for the adequacy or accuracy of this news release.
SOURCE: Rogue Resources Inc.
View source version on accesswire.com:
https://www.accesswire.com/639923/Rogue-Update-Appoints-new-CFO-Landscape-Stone-Sales-continue-through-February-and-March
Just because a business does not make any money, does not mean that the stock will go down. Indeed, Havilah Resources (ASX:HAV) stock is up 138% in the last year, providing strong gains for shareholders. But the harsh reality is that very many loss making companies burn through all their cash and go bankrupt.
Given its strong share price performance, we think it's worthwhile for Havilah Resources shareholders to consider whether its cash burn is concerning. In this article, we define cash burn as its annual (negative) free cash flow, which is the amount of money a company spends each year to fund its growth. First, we'll determine its cash runway by comparing its cash burn with its cash reserves.
View our latest analysis for Havilah Resources
How Long Is Havilah Resources' Cash Runway?
A cash runway is defined as the length of time it would take a company to run out of money if it kept spending at its current rate of cash burn. Havilah Resources has such a small amount of debt that we'll set it aside, and focus on the AU$5.9m in cash it held at January 2021. In the last year, its cash burn was AU$2.9m. Therefore, from January 2021 it had 2.0 years of cash runway. Arguably, that's a prudent and sensible length of runway to have. Depicted below, you can see how its cash holdings have changed over time.

How Is Havilah Resources' Cash Burn Changing Over Time?
Whilst it's great to see that Havilah Resources has already begun generating revenue from operations, last year it only produced AU$167k, so we don't think it is generating significant revenue, at this point. As a result, we think it's a bit early to focus on the revenue growth, so we'll limit ourselves to looking at how the cash burn is changing over time. Notably, its cash burn was actually down by 57% in the last year, which is a real positive in terms of resilience, but uninspiring when it comes to investment for growth. Admittedly, we're a bit cautious of Havilah Resources due to its lack of significant operating revenues. So we'd generally prefer stocks from this list of stocks that have analysts forecasting growth.
Can Havilah Resources Raise More Cash Easily?
While we're comforted by the recent reduction evident from our analysis of Havilah Resources' cash burn, it is still worth considering how easily the company could raise more funds, if it wanted to accelerate spending to drive growth. Generally speaking, a listed business can raise new cash through issuing shares or taking on debt. Commonly, a business will sell new shares in itself to raise cash and drive growth. By comparing a company's annual cash burn to its total market capitalisation, we can estimate roughly how many shares it would have to issue in order to run the company for another year (at the same burn rate).
Since it has a market capitalisation of AU$61m, Havilah Resources' AU$2.9m in cash burn equates to about 4.7% of its market value. That's a low proportion, so we figure the company would be able to raise more cash to fund growth, with a little dilution, or even to simply borrow some money.
So, Should We Worry About Havilah Resources' Cash Burn?
As you can probably tell by now, we're not too worried about Havilah Resources' cash burn. For example, we think its cash burn relative to its market cap suggests that the company is on a good path. And even its cash runway was very encouraging. After taking into account the various metrics mentioned in this report, we're pretty comfortable with how the company is spending its cash, as it seems on track to meet its needs over the medium term. Taking a deeper dive, we've spotted 4 warning signs for Havilah Resources you should be aware of, and 2 of them are significant.
If you would prefer to check out another company with better fundamentals, then do not miss this free list of interesting companies, that have HIGH return on equity and low debt or this list of stocks which are all forecast to grow.
This article by Simply Wall St is general in nature. It does not constitute a recommendation to buy or sell any stock, and does not take account of your objectives, or your financial situation. We aim to bring you long-term focused analysis driven by fundamental data. Note that our analysis may not factor in the latest price-sensitive company announcements or qualitative material. Simply Wall St has no position in any stocks mentioned.
Have feedback on this article? Concerned about the content? Get in touch with us directly. Alternatively, email editorial-team (at) simplywallst.com.
Just because a business does not make any money, does not mean that the stock will go down. For example, although Amazon.com made losses for many years after listing, if you had bought and held the shares since 1999, you would have made a fortune. But the harsh reality is that very many loss making companies burn through all their cash and go bankrupt.
Given this risk, we thought we'd take a look at whether Prairie Mining (ASX:PDZ) shareholders should be worried about its cash burn. In this report, we will consider the company's annual negative free cash flow, henceforth referring to it as the 'cash burn'. Let's start with an examination of the business' cash, relative to its cash burn.
View our latest analysis for Prairie Mining
How Long Is Prairie Mining's Cash Runway?
You can calculate a company's cash runway by dividing the amount of cash it has by the rate at which it is spending that cash. When Prairie Mining last reported its balance sheet in December 2020, it had zero debt and cash worth AU$6.0m. Looking at the last year, the company burnt through AU$2.1m. That means it had a cash runway of about 2.9 years as of December 2020. Arguably, that's a prudent and sensible length of runway to have. You can see how its cash balance has changed over time in the image below.

How Is Prairie Mining's Cash Burn Changing Over Time?
Whilst it's great to see that Prairie Mining has already begun generating revenue from operations, last year it only produced AU$389k, so we don't think it is generating significant revenue, at this point. Therefore, for the purposes of this analysis we'll focus on how the cash burn is tracking. While it hardly paints a picture of imminent growth, the fact that it has reduced its cash burn by 49% over the last year suggests some degree of prudence. Prairie Mining makes us a little nervous due to its lack of substantial operating revenue. We prefer most of the stocks on this list of stocks that analysts expect to grow.
How Hard Would It Be For Prairie Mining To Raise More Cash For Growth?
Even though it has reduced its cash burn recently, shareholders should still consider how easy it would be for Prairie Mining to raise more cash in the future. Generally speaking, a listed business can raise new cash through issuing shares or taking on debt. Many companies end up issuing new shares to fund future growth. By comparing a company's annual cash burn to its total market capitalisation, we can estimate roughly how many shares it would have to issue in order to run the company for another year (at the same burn rate).
Prairie Mining has a market capitalisation of AU$55m and burnt through AU$2.1m last year, which is 3.8% of the company's market value. Given that is a rather small percentage, it would probably be really easy for the company to fund another year's growth by issuing some new shares to investors, or even by taking out a loan.
Is Prairie Mining's Cash Burn A Worry?
As you can probably tell by now, we're not too worried about Prairie Mining's cash burn. In particular, we think its cash runway stands out as evidence that the company is well on top of its spending. But it's fair to say that its cash burn reduction was also very reassuring. After taking into account the various metrics mentioned in this report, we're pretty comfortable with how the company is spending its cash, as it seems on track to meet its needs over the medium term. On another note, we conducted an in-depth investigation of the company, and identified 4 warning signs for Prairie Mining (1 is a bit concerning!) that you should be aware of before investing here.
Of course, you might find a fantastic investment by looking elsewhere. So take a peek at this free list of companies insiders are buying, and this list of stocks growth stocks (according to analyst forecasts)
This article by Simply Wall St is general in nature. It does not constitute a recommendation to buy or sell any stock, and does not take account of your objectives, or your financial situation. We aim to bring you long-term focused analysis driven by fundamental data. Note that our analysis may not factor in the latest price-sensitive company announcements or qualitative material. Simply Wall St has no position in any stocks mentioned.
Have feedback on this article? Concerned about the content? Get in touch with us directly. Alternatively, email editorial-team (at) simplywallst.com.
Vancouver, British Columbia–(Newsfile Corp. – April 9, 2021) – Dynasty Gold Corp. (TSXV: DYG) (FSE: D5G) (OTC Pink: DGDCF) ("Dynasty" or the "Company") is pleased to announce that subject to Exchange approval, it has completed the first tranche of an oversubscribed non-brokered private placement of 3,026,176 units for gross proceeds of $514,450. Each unit consists of one common share at $0.17 and one common share purchase warrant at $0.25 for a period of two years. The Company shall have the right to call the outstanding Warrants for expiry upon 20 days notice in the event that the closing price of the common shares of the Company on the TSX-V is above $0.35 for 10 consecutive trading days. The units issued under the private placement are subject to a four-month hold period from the date of closing.
The proceeds from the private placement will be used to advance the company's gold projects and for general corporate purposes.
A drill permit was recently received for the Thundercloud project in Ontario. The Golden Repeat project in Nevada has a current drill permit. Exploration program planning is in progress and details will be announced in due course.
About Dynasty Gold Corp.
Dynasty Gold Corp. is a Canadian exploration company currently focused on gold exploration in North America with projects located in greenstone belts in Ontario and the Midas gold camp in Nevada. Currently, the 70% owned Hatu Qi2 gold mine in the Tien Shan Gold belt, Xinjiang, China, is in legal dispute with Xinjiang Non-Ferrous Industrial Metals Group and its subsidiary Western Region Gold Co. Ltd.. For more information, please visit Company's website www.dynastygoldcorp.com.
ON BEHALF OF THE BOARD OF DYNASTY GOLD CORP.
"Ivy Chong"
_________________________________
Ivy Chong, President & CEO
For additional information please contact:
Vancouver Office:
Ivy Chong
Phone: 604.633.2100. Email: ichong@dynastygoldcorp.com
This press release contains certain "forward-looking statements" that involve a number of risks and uncertainties. There can be no assurance that such statements will prove to be accurate and actual results and future events could differ materially from those anticipated in such statements. The TSX Venture Exchange has not reviewed and does not accept responsibility for the adequacy or accuracy of this release.

To view the source version of this press release, please visit https://www.newsfilecorp.com/release/80007
TORONTO, April 09, 2021 (GLOBE NEWSWIRE) — Xanadu Mines Ltd (ASX: XAM, TSX: XAM) (Xanadu or the Company) wishes to advise the appointment of Tony Pearson as a Non-Executive Director of the Company, effective 3 May 2021.
Mr Pearson is an experienced industry executive and company director who has lived and worked in Mongolia, China, Hong Kong, the Philippines and Indonesia. He has a strong understanding of emerging jurisdictions, balanced with the need for western governance practices. He has experience raising capital across equities, hybrids, bonds, convertibles and project finance in numerous jurisdictions. Tony is currently Chair of Peak Resources Limited (ASX:PEK) having been nominated by Appian Capital Advisory, a leading natural resources private equity group. Tony is also Chair of Cellnet Group Limited (ASX:CLT), a Trustee of the Royal Botanic Garden & Domain Trust, a Non-Executive Director of Communicare and a former Non-Executive Director of Aspire Mining Limited (ASX:AKM) and Group Executive of SouthGobi Resources Ltd (TSX:SGQ, HKEX:1878). Prior to these non-executive appointments, Tony was a Managing Director at HSBC, where he led the bank’s Australasian natural resources business.
Andrew Stewart, Chief Executive Officer, said “I would like to welcome Mr Pearson to the Xanadu team and look forward to working with him and the Board as we lead Xanadu through the next stage of the Company’s growth strategy.”
Colin Moorhead, Non-Executive Chairman, said “Tony will make a strong addition to the Xanadu Board, which is now made up of a majority of Independent Non-Executive Directors. This is an exciting time to join, with our flagship Kharmagtai project at a critical point in its development. Welcome Tony to the Xanadu team.”
Mr Pearson will be paid a fee of A$60,000 p.a. and is eligible to participate in the Company’s Equity Incentive Plan.
For further information, please contact:
Andrew Stewart
Chief Executive Officer
Xanadu Mines Ltd M: +61 409 819 922
E: Andrew.stewart@xanadumines.com
W: www.xanadumines.com
This Announcement was authorised for release by Xanadu’s Board of Directors.
About Xanadu Mines Ltd:
Xanadu is an ASX and TSX listed Exploration company operating in Mongolia. We give investors exposure to globally significant, large scale copper-gold discoveries and low-cost inventory growth. Xanadu maintains a portfolio of exploration projects and remains one of the few junior explorers on the ASX or TSX who control an emerging Tier 1 copper-gold deposit in our flagship Kharmagtai project. For information on Xanadu visit: www.xanadumines.com.
Legendary fund manager Li Lu (who Charlie Munger backed) once said, 'The biggest investment risk is not the volatility of prices, but whether you will suffer a permanent loss of capital.' So it seems the smart money knows that debt – which is usually involved in bankruptcies – is a very important factor, when you assess how risky a company is. As with many other companies Hochschild Mining plc (LON:HOC) makes use of debt. But is this debt a concern to shareholders?
What Risk Does Debt Bring?
Debt assists a business until the business has trouble paying it off, either with new capital or with free cash flow. In the worst case scenario, a company can go bankrupt if it cannot pay its creditors. However, a more common (but still painful) scenario is that it has to raise new equity capital at a low price, thus permanently diluting shareholders. By replacing dilution, though, debt can be an extremely good tool for businesses that need capital to invest in growth at high rates of return. The first step when considering a company's debt levels is to consider its cash and debt together.
Check out our latest analysis for Hochschild Mining
What Is Hochschild Mining's Debt?
As you can see below, at the end of December 2020, Hochschild Mining had US$210.3m of debt, up from US$199.5m a year ago. Click the image for more detail. But it also has US$231.9m in cash to offset that, meaning it has US$21.6m net cash.

A Look At Hochschild Mining's Liabilities
The latest balance sheet data shows that Hochschild Mining had liabilities of US$173.4m due within a year, and liabilities of US$386.6m falling due after that. On the other hand, it had cash of US$231.9m and US$69.2m worth of receivables due within a year. So its liabilities outweigh the sum of its cash and (near-term) receivables by US$258.9m.
Of course, Hochschild Mining has a market capitalization of US$1.48b, so these liabilities are probably manageable. But there are sufficient liabilities that we would certainly recommend shareholders continue to monitor the balance sheet, going forward. Despite its noteworthy liabilities, Hochschild Mining boasts net cash, so it's fair to say it does not have a heavy debt load!
On the other hand, Hochschild Mining saw its EBIT drop by 2.3% in the last twelve months. That sort of decline, if sustained, will obviously make debt harder to handle. When analysing debt levels, the balance sheet is the obvious place to start. But it is future earnings, more than anything, that will determine Hochschild Mining's ability to maintain a healthy balance sheet going forward. So if you're focused on the future you can check out this free report showing analyst profit forecasts.
Finally, a business needs free cash flow to pay off debt; accounting profits just don't cut it. While Hochschild Mining has net cash on its balance sheet, it's still worth taking a look at its ability to convert earnings before interest and tax (EBIT) to free cash flow, to help us understand how quickly it is building (or eroding) that cash balance. During the last three years, Hochschild Mining produced sturdy free cash flow equating to 77% of its EBIT, about what we'd expect. This free cash flow puts the company in a good position to pay down debt, when appropriate.
Summing up
Although Hochschild Mining's balance sheet isn't particularly strong, due to the total liabilities, it is clearly positive to see that it has net cash of US$21.6m. The cherry on top was that in converted 77% of that EBIT to free cash flow, bringing in US$88m. So we don't think Hochschild Mining's use of debt is risky. When analysing debt levels, the balance sheet is the obvious place to start. However, not all investment risk resides within the balance sheet – far from it. For instance, we've identified 4 warning signs for Hochschild Mining that you should be aware of.
At the end of the day, it's often better to focus on companies that are free from net debt. You can access our special list of such companies (all with a track record of profit growth). It's free.
This article by Simply Wall St is general in nature. It does not constitute a recommendation to buy or sell any stock, and does not take account of your objectives, or your financial situation. We aim to bring you long-term focused analysis driven by fundamental data. Note that our analysis may not factor in the latest price-sensitive company announcements or qualitative material. Simply Wall St has no position in any stocks mentioned.
Have feedback on this article? Concerned about the content? Get in touch with us directly. Alternatively, email editorial-team (at) simplywallst.com.
DENVER, CO / ACCESSWIRE / April 7, 2021 /Solitario Zinc Corp. ("Solitario") (NYSE American:XPL) (TSX:SLR) is pleased to announce that it has filed on SEDAR the independent NI 43-101 Technical Report (the "Report") detailing the updated Mineral Resource Estimate for the Florida Canyon Project located in northern Peru, as described in the Company's news release dated February 23, 2021. The Report was prepared by Gustavson Associates LLC ("Gustavson"), an independent international engineering firm specializing in mining and mineral exploration engineering and evaluation. The Report is available on SEDAR under the Company's profile, and on the Company's website at: Florida Canyon NI 43-101 Technical Report.
The Report filed today incorporates technical information from 39 new drill holes completed at Florida Canyon in 2018 and 2019, along with information from 506 previously drilled core holes. The Report shows a substantial increase in inferred resources dominated by zinc sulfide mineralization. Highlights include the following:
-
Inferred zinc-equivalent ("Zn-Eq") sulfide resource up 105% from 2017 estimate.
-
Inferred Zn-Eq sulfide-mixed-oxide resource estimate up 64% from 2017 estimate.
-
Total contained metal – Measured and Indicated: 0.65 billion pounds Zn-Eq.
-
Total contained metal – Inferred: 3.39 billion pounds Zn-Eq at 10.9% Zn-Eq.
-
Total contained silver – Inferred: 5.39 million oz.; Meas. & Ind: 1.2 million oz.
Solitario's joint venture partner, Nexa Resources S.A. (NYSE:NEXA; TSX:NEXA) ("Nexa"), completed the new resource estimate incorporating the results of the 2018/2019 drilling program and reinterpreting portions of the previous resource model. Solitario, through the work of Gustavson, verified Nexa's resource estimate. Nexa is the world's fourth largest zinc miner and operates three underground zinc mines in Peru, a major zinc smelter also in Peru and two zinc mines and two zinc smelters in Brazil.
The 2021 Mineral Resource Estimate is a mine plan constrained resource that takes into consideration various NSR cutoff grades and planned dilution, depending on mining method. All 2021 additions to the resource were in the Inferred Resource Category. The table below provides summary estimates for all resource categories.
2021 Florida Canyon Mineral Resource Estimate
|
Category |
Tonnes Millions |
Zinc % |
Lead % |
Silver g/t |
ZnEq % |
Contained Metal Zinc-Equivalent Billion Lbs. |
Contained Silver Million Ozs. |
|
Measured |
0.81 |
11.32 |
1.40 |
15.4 |
12.78 |
0.29 |
0.40 |
|
Indicated |
1.63 |
10.28 |
1.31 |
14.9 |
11.66 |
0.42 |
0.78 |
|
M + I |
2.44 |
10.63 |
1.34 |
15.05 |
12.04 |
0.65 |
1.18 |
|
Inferred |
14.86 |
9.63 |
1.26 |
11.3 |
10.89 |
3.57 |
5.39 |
Notes to Mineral Resource Table:
1. CIM (2014) definitions were followed for Mineral Resources.
2. Mineral Resources have an effective date as of February 2, 2021.
3. Mineral Resources are reported using mining cut off values of US$41.40/t NSR for Sub-Level Stoping, US$42.93/t for Cut and Fill and US$40.61/t for Room and Pillar mining methods.
4. Forecast long term metal prices used for the NSR and Zn-Eq calculations are: Zn: US$2,816/t (US$1.27/lb); Pb: US$ 2,249/t (US$1.02/lb) and Ag: US$19.40/oz. Zn-Eq calculations do not take into account metallurgical recoveries.
5. Minimum mining thickness is 3 meters for Sub-Level Stoping and Cut and Fill, and 4 meters for Room and Pillar mining methods.
6. Mineral Resources are not Mineral Reserves and do not have demonstrated economic viability.
7. Project Resources are reported on a 100% ownership basis.
8. Numbers may not add due to rounding.
Inferred Sulfide Resource Doubles
The 2018/2019 drilling program was specifically designed to identify new NI 43-101 compliant sulfide resources at Florida Canyon. This objective was achieved with an overall 105% gain in Inferred Zn-Eq contained metal in sulfide resources compared to the 2017 Inferred Zn-Eq sulfide resource estimate. Approximately 78% of the Zn-Eq resources are sulfide-dominate in the overall 2021 resource estimate.
Sulfide Mineralization is Important
The 2017 Preliminary Economic Assessment ("PEA" see SEDAR Filing dated August 8, 2017) demonstrated that mining and processing of Florida Canyon sulfide resources are much more profitable than for oxide and mixed resources. Cash flow estimates in the PEA for its 12.5-year mine life, based on the 2017 resource, illustrated that years 2-7 (mostly sulfide ore) generated approximately $75 million in annual free cash flow, while years 8-12 (mostly oxide+mixed ore) averaged approximately $30 million in annual free cash flow.
In addition to an increased mine life and cash flow, the current, larger resource will also provide the opportunity to assess increasing the production rate from the 2,500 tonnes per day assumed in the PEA, further improving project profitability.
Recommendations
The Report contains several important recommendations for advancing the Florida Canyon Project. One of the more impacting recommendations, is to conduct new metallurgical testing on sulfide-dominant ores. The updated resource model demonstrates that the majority of mineralization at Florida Canyon is sulfide dominant, however, previously conducted metallurgy did not assess sulfide-only ore. The Report suggests that metallurgical zinc recoveries and zinc concentrate grades were underestimated in the 2017 Preliminary Economic Analysis. Higher zinc recoveries and concentrate grade, along with a larger resource base would substantially benefit project economics.
Another important recommendation includes additional surface and underground exploration. Included in this is 1,250 meters of underground tunnel development in two different zones, 15,000 meters of underground drilling and 10,000 meters of surface drilling. The objective of these programs is to increase the confidence level of a portion of the inferred resource to measured and indicated categories.
Signed by Qualified Persons:
The technical information contained in the Report has been verified and approved by the following Gustavson Qualified Persons pursuant to the meaning of such terms in National Instrument 43-101 Standards of Disclosure for Mineral Projects.
Mr. Donald Hulse, P.E., SME-RM (Mining, Resources)
Deepak Malhotra, PhD., SME-RM (Metallurgy)
Mr. Simon Mortimer, MSc., MAIG (Geology)
Information contained within this release is reported under Nexa's quality control program reviewed by Mr. Walt Hunt, COO for Solitario Zinc Corp., who is a qualified person as defined by National Instrument 43-101.
Terms of the Florida Canyon Joint Venture
Solitario owns a 39% interest and Nexa owns a 61% indirect interest in the Florida Canyon project. Nexa can earn a 70% interest in the Florida Canyon project by continuing to fund all project expenditures and committing to place the project into production based upon a positive feasibility study. After earning 70%, and at the request of Solitario, Nexa has further agreed to finance Solitario's 30% participating interest for construction through a project loan. Solitario will repay the loan facility through 50% of its net cash flow distributions from production.
About Solitario
Solitario is an emerging zinc exploration and development company traded on the NYSE American ("XPL") and on the Toronto Stock Exchange ("SLR"). Solitario holds a 50% joint venture interest in the high-grade, open-pittable Lik zinc deposit in Alaska and a 39% joint venture interest (Nexa Resources holds the remaining 61% interest) in the high-grade Florida Canyon zinc project in Peru. Solitario's Management and Directors hold approximately 9.6% (excluding options) of the Company's 58.4 million shares outstanding. Solitario's cash balance and marketable securities stand at approximately US$7.7 million. Additional information about Solitario is available online at www.solitariozinc.com
FOR MORE INFORMATION ABOUT SOLITARIO, CONTACT:
Valerie Kimball
Director – Investor Relations
(720) 933-1150
(800) 229-6827
Christopher E. Herald
President & CEO
(303) 534-1030, Ext. 14
Cautionary Statement Regarding Forward Looking Information
This press release contains forward-looking statements within the meaning of the U.S. Securities Act of 1933 and the U.S. Securities Exchange Act of 1934, and as defined in the United States Private Securities Litigation Reform Act of 1995 (and the equivalent under Canadian securities laws),that are intended to be covered by the safe harbor created by such sections. Forward-looking statements are statements that are not historical fact. They are based on the beliefs, estimates and opinions of the Company's management on the date the statements are made and address activities, events or developments that Solitario expects or anticipates will or may occur in the future, and are based on current expectations and assumptions. Forward-looking statements involve a number of risks and uncertainties. Consequently, there can be no assurances that such statements will prove to be accurate and actual results and future events could differ materially from those anticipated in such statements. Such forward-looking statements include, without limitation, statements regarding the Company's expectation of the projected timing and outcome of engineering studies; expectations regarding the receipt of all necessary permits and approvals to implement a mining plan, if any, at Lik or Florida Canyon; the potential for confirming, upgrading and expanding zinc, lead and silver mineralized material; future operating and capital cost estimates may indicate that the stated resources may not be economic; estimates of zinc, lead and silver grades of resources provided are predicted and actual mining grade could be substantially lower; estimates of recovery rates for could be lower than estimated for establishing the cutoff grade; and other statements that are not historical facts could vary significantly from assumptions made in the Resources Estimate. Mineral Resources are not Mineral Reserves and do not have demonstrated economic viability. Although Solitario management believes that its expectations are based on reasonable assumptions, it can give no assurance that these expectations will prove correct. Important factors that could cause actual results to differ materially from those in the forward-looking statements include, among others, risks relating to risks that Solitario's and its joint venture partners' exploration and property advancement efforts will not be successful; risks relating to fluctuations in the price of zinc, lead and silver; the inherently hazardous nature of mining-related activities; uncertainties concerning reserve and resource estimates; availability of outside contractors, and other activities; uncertainties relating to obtaining approvals and permits from governmental regulatory authorities; the possibility that environmental laws and regulations will change over time and become even more restrictive; and availability and timing of capital for financing the Company's exploration and development activities, including uncertainty of being able to raise capital on favorable terms or at all; as well as those factors discussed in Solitario's filings with the U.S. Securities and Exchange Commission (the "SEC") including Solitario's latest Annual Report on Form 10-K and its other SEC filings (and Canadian filings) including, without limitation, its latest Quarterly Report on Form 10-Q. The Company does not intend to publicly update any forward-looking statements, whether as a result of new information, future events, or otherwise, except as may be required under applicable securities laws.
Cautionary Note to U.S. Investors concerning Estimates of Measured, Indicated and Inferred Resources
This news release has been prepared in accordance with the requirements of the securities laws in effect in Canada, which differ from the requirements of United States securities laws. Canadian reporting requirements for disclosure of mineral properties are governed by the Canadian Securities Administrators' National Instrument 43-101 Standards of Disclosure for Mineral Projects ("NI 43-101"). For this reason, information contained in this news release containing descriptions of the Company's mineral deposits may not be comparable to similar information made public by United States companies subject to the reporting and disclosure requirements under the United States federal securities laws and the rules and regulations thereunder.
SOURCE: Solitario Zinc Corp.
View source version on accesswire.com:
https://www.accesswire.com/639313/Solitario-Files-New-NI-43-101-Technical-Report-for-Its-Florida-Canyon-Zinc-Project-Detailing-a-Significant-Increase-in-Mineral-Resources
It's only natural that many investors, especially those who are new to the game, prefer to buy shares in 'sexy' stocks with a good story, even if those businesses lose money. Unfortunately, high risk investments often have little probability of ever paying off, and many investors pay a price to learn their lesson.
So if you're like me, you might be more interested in profitable, growing companies, like Zimplats Holdings (ASX:ZIM). While that doesn't make the shares worth buying at any price, you can't deny that successful capitalism requires profit, eventually. In comparison, loss making companies act like a sponge for capital – but unlike such a sponge they do not always produce something when squeezed.
See our latest analysis for Zimplats Holdings
Zimplats Holdings's Improving Profits
In the last three years Zimplats Holdings's earnings per share took off like a rocket; fast, and from a low base. So the actual rate of growth doesn't tell us much. As a result, I'll zoom in on growth over the last year, instead. Like a firecracker arcing through the night sky, Zimplats Holdings's EPS shot from US$1.36 to US$4.01, over the last year. Year on year growth of 195% is certainly a sight to behold. That could be a sign that the business has reached a true inflection point.
Careful consideration of revenue growth and earnings before interest and taxation (EBIT) margins can help inform a view on the sustainability of the recent profit growth. Zimplats Holdings shareholders can take confidence from the fact that EBIT margins are up from 35% to 53%, and revenue is growing. Ticking those two boxes is a good sign of growth, in my book.
You can take a look at the company's revenue and earnings growth trend, in the chart below. Click on the chart to see the exact numbers.

While profitability drives the upside, prudent investors always check the balance sheet, too.
Are Zimplats Holdings Insiders Aligned With All Shareholders?
It makes me feel more secure owning shares in a company if insiders also own shares, thusly more closely aligning our interests. As a result, I'm encouraged by the fact that insiders own Zimplats Holdings shares worth a considerable sum. To be specific, they have US$17m worth of shares. That's a lot of money, and no small incentive to work hard. Even though that's only about 0.6% of the company, it's enough money to indicate alignment between the leaders of the business and ordinary shareholders.
Is Zimplats Holdings Worth Keeping An Eye On?
Zimplats Holdings's earnings have taken off like any random crypto-currency did, back in 2017. That EPS growth certainly has my attention, and the large insider ownership only serves to further stoke my interest. The hope is, of course, that the strong growth marks a fundamental improvement in the business economics. So yes, on this short analysis I do think it's worth considering Zimplats Holdings for a spot on your watchlist. We should say that we've discovered 2 warning signs for Zimplats Holdings that you should be aware of before investing here.
You can invest in any company you want. But if you prefer to focus on stocks that have demonstrated insider buying, here is a list of companies with insider buying in the last three months.
Please note the insider transactions discussed in this article refer to reportable transactions in the relevant jurisdiction.
This article by Simply Wall St is general in nature. It does not constitute a recommendation to buy or sell any stock, and does not take account of your objectives, or your financial situation. We aim to bring you long-term focused analysis driven by fundamental data. Note that our analysis may not factor in the latest price-sensitive company announcements or qualitative material. Simply Wall St has no position in any stocks mentioned.
Have feedback on this article? Concerned about the content? Get in touch with us directly. Alternatively, email editorial-team (at) simplywallst.com.
Vancouver, British Columbia–(Newsfile Corp. – April 7, 2021) – Orestone Mining Corp. (TSXV: ORS) (FSE: O2R1) is pleased to announce that all contractors have been selected and retained to carry out the 2021 Phase I drill program at the Captain project. Equipment mobilization is underway with drilling estimated to start on or about April 10, 2021. The exploration model at Captain is a large scale potassic-sericite altered calc-alkaline gold-copper porphyry target.
The drill program will consist of 1,000 to 2,000 meters of core drilling in 2 – 3 holes and is budgeted at $300,000 to $600,000 designed to follow up and test for porphyry mineralization intersected in holes C13-03 and C19-03. Hole C13-03 intersected a 3 meter sulphide rich mineralized xenolith which assayed 1.9 g/t gold, 11 g/t silver and 0.23 % copper within an otherwise unaltered and barren post mineral dyke. Hole C19-03, located 250m south of C13-03 intersected visually identical porphyry at 271m with the bottom 24m of the hole (271m – 295m) grading 0.27 g/t gold, 3.26 g/t silver and 0.09 % copper. The hole ended in 0.49 g/t gold, 3.0 g/t silver and 0.11 % copper at 295m and remains open to depth.
The porphyry system is associated with a distinctive magnetic low measuring 600m x 1300m surrounded by a crescent shaped magnetic high associated with propylitically altered diorite/monzonite (see website for maps). Induced Polarization ("IP") geophysical data from the western portion of the target are consistent with the model of a sulphide rich porphyry body beneath a 30 to 100m layer of glacial till and a 100-150m thick phyllic altered cap.
Logistics for the drill program are excellent as all of the drill locations are on existing roads with easy access one hours drive north of Fort St. James in north central BC. The Captain Project features relatively flat terrain, moderate tree cover and an extensive network of logging and Forest Service roads suitable for exploration year around. All permits are in place for 24 drill locations.
"The focus of this drill program is an exciting calc-alkaline porphyry target. This type of deposit can be quite large, gold rich and in some cases with a higher-grade core such as the Red Chris Deposit in BC and the Cadia-Ridgeway Deposits in New South Wales, Australia. We are very encouraged by the exploration results to date, in which visually identical potassic-sericite altered porphyry intersected in holes 250 meters apart graded up to 1.9 g/t gold. In terms of size, the outer phyllic alteration halo has been intersected in drilling over an area of 1.5 by 2 kilometers indicating the presence of a large hydrothermal fluid rich system. Drilling will be underway shortly," stated David Hottman, CEO and Director of Orestone Mining Corp.
Gary Nordin, P.Geo, a director of the Company, is a qualified person as defined by National Instrument 43-101. Mr. Nordin has reviewed and approved the technical information in this press release.
The 100 percent owned Captain gold-copper project encompasses 37 square kilometers and hosts a large porphyry system located 41 kilometers north of Fort St. James and 30 kilometers south of the Mt. Milligan copper-gold mine in north central British Columbia. The Captain Project features relatively flat terrain, moderate tree cover and an extensive network of logging and Forest Service roads suitable for exploration year around. To stay informed of the latest corporate activities please click here to provide consent and receive news and updates. For more information, please visit Orestone's website at www.orestone.ca.
ON BEHALF OF ORESTONE MINING CORP.
David Hottman
CEO
For further information please contact:
Tel: 604-629-1929
Fax: 604-629-1930
Email: info@orestone.ca
Website: www.orestone.ca
Neither the TSX Venture Exchange nor its Regulation Services Provider (as that term is defined in the policies of the TSX Venture Exchange) accepts responsibility for the adequacy or accuracy of this News Release. This news release has been prepared by management and no regulatory authority has approved or disapproved the information contained herein.
Forward-Looking Statements
This news release contains certain forward-looking statements, which relate to future events or future performance and reflect management's current expectations and assumptions. Such forward-looking statements reflect management's current beliefs and are based on assumptions made by and information currently available to the Company. Readers are cautioned that these forward-looking statements are neither promises nor guarantees, and are subject to risks and uncertainties that may cause future results to differ materially from those expected including, but not limited to, market conditions, availability of financing, currency rate fluctuations, actual results of exploration and development activities, environmental risks, future prices of copper, gold, silver and other metals, operating risks, accidents, labor issues, delays in obtaining governmental or regulatory approvals and permits, and other risks in the mining industry. In addition, there is uncertainty about the spread of the COVID-19 virus and the impact it will have on the Company's operations, global supply chains and economic activity in general. All the forward-looking statements made in this news release are qualified by these cautionary statements and those in our continuous disclosure filings available on SEDAR at www.sedar.com. These forward-looking statements are made as of the date hereof and the Company does not assume any obligation to update or revise them to reflect new events or circumstances save as required by applicable law.

To view the source version of this press release, please visit https://www.newsfilecorp.com/release/79669
SLAM Exploration Acquiring More Properties In Emerging Gold District
MIRAMICHI, New Brunswick, April 07, 2021 (GLOBE NEWSWIRE) — SLAM Exploration Ltd. (“SLAM” or the “Company” on TSXV: SXL) is pleased to report the acquisition of 2 new mineral claims through a Purchase Agreement with a prospector. The claims cover till anomalies ranging up to 580 parts per billion (“ppb”) gold and are adjacent to the Triple Fault claims owned by Puma Exploration Inc.(“Puma”) and is located 100 km west of Bathurst New Brunswick. Puma reports that “previous holes intersected 11.2 g/t over 2.8m, 8.02 g/t Au over 1.0m, 1.0 g/t over 23.0m, 3.46 g/t Au over 2.0m” and the presence of “many gold occurrences up to 109.0 g/t, 50.8 g/t Au, 28 g/t Au, 17 g/t Au” on its Triple Fault claims.
The Company bought 100% interest in two mineral claims in return for 70,000 shares. The Vendor retains a 2% NSR royalty. SLAM holds the right to buy back 1% NSR for $1,000,000 and holds right of first refusal on the remaining 1% NSR. The NSR does not apply to additional claims staked by the Company adjacent to the Purchase Agreement claims.
The Williams Brook East Gold Property: One claim comprising 7 units was acquired in the Purchase Agreement. SLAM acquired an adjacent claim comprising 35 units by E-staking (on the NB-Eclaims portal). The combined claims cover 912 hectares of prospective ground with till anomalies ranging up to 580 ppb. Two regional faults cutting through the property confirm this to be part of the Triple Fault area.
The Jonpol East Gold Property: One claim comprising 5 units was acquired in the Purchase Agreement. SLAM acquired an adjacent claim comprising 45 units by E-staking. The combined claims cover 1,086 hectares of prospective ground with till anomalies ranging up to 28 ppb and located 1,000 m east of the Simpson Field gold occurrence.
The Ramsay Gold Property: SLAM staked an additional 3 claims adjacent to its previously staked Ramsay mineral claim. The Ramsay property now comprises 100 units in 4 claims covering 2392 hectares of prospective ground with a number of till anomalies ranging up to 34 ppb gold. The Ramsay property is transected by the Greys Gulch, McCormack Brook, McIntyre Brook, Ramsay Brook and Simpson Brook faults and is adjacent to the Ramsay copper-cobalt occurrence which has been described as an IOCG (Iron Oxide Copper Gold) type of occurrence.
All three properties are located just south of the Rocky Brook-Millstream Break (“Millstream Break”) adjacent to the Triple Fault properties owned by Puma. The Millstream Break is a major Appalachian structure associated with significant gold discoveries in New Brunswick including the Williams Brook gold discovery owned by Puma Resources Inc. and the Elmtree gold deposit owned by Canadian GoldCamps Corp. as well as SLAM’s Wilson Brook gold property located 60 km to the southwest.
SLAM’s Flagship Menneval Gold Project: SLAM’s 2020 exploration program resulted in discovery of numerous new gold-bearing veins including No 18 where the Company reported 12 sites of visible gold and assay results grading 1.22 to 3,955 g/t gold over widths ranging from 0.04 to 0.12 m thick. A soil geochemical survey comprising 897 samples detected gold levels ranging up to 683 ppb gold and anomalous gold trends up to 1,800 m long. These gold anomalies are located close to and along strike from known gold veins and are largely untested. More information is available on SLAM’s new website www.slamexploration.com.
The new gold vein discoveries and associated soil anomalies suggest potential for sizeable and economically viable gold deposits in an area with excellent access and infrastructure. They are hosted with a sequence of sedimentary and intrusive rocks that occupy an antiformal structure in the footwall of the Restigouche fault. The Restigouche fault is part of a major Appalachian suture that extends from the Haile gold mine operated by OceanaGold in South Carolina through Marathon’s Valentine Lake gold deposit in Newfoundland to Dalradian’s Curraginalt gold deposit in Ireland.
The Menneval gold project comprises 572 mineral claim units in 8 mineral claims covering 12,450 hectares The Company holds a 100% interest in the claims with the exception of 4 claim units covering 105 hectares that are subject to a 1.5% NSR. The Company can buy down 0.5% of the NSR for $500,000 and it has the right of first refusal on the remaining 1% NSR.
The Company intends to focus its 2021 exploration strategy on the Menneval gold project. The first priority of the 2021 exploration program is to test significant gold trends in soils as reported by the news release dated January 19, 2021 and potential extensions of gold veins discovered in 2020.
Website: SLAM Exploration Ltd recently launched a completely updated and renovated website at the following address: www.slamexploration.com
About SLAM Exploration Ltd:
SLAM is a project-generating resource company with a 68,000 hectare portfolio of wholly-owned gold, silver, base metal and REE properties in New Brunswick. The primary corporate focus is on our flagship Menneval gold project in northern New Brunswick and this will continue to be the focus for 2021. The Company owns the Birch Lake gold-silver project and the Lewis Brook silver project in central New Brunswick. The Company is actively involved in the evolving southern New Brunswick gold play where Galway Gold Inc. continues to report successful gold drilling results at Clarence Stream. These properties are available for purchase or joint venture and companies looking for potential property acquisitions should contact Mike Taylor by email mike@slamexploration.com or phone 506-623-8960.
The Company owns the Uniacke gold project comprising 2 claims held under an option agreement and one claim staked by the Company and located in Nova Scotia. SLAM owns the Reserve Creek, Opikeigen and Miminiska gold projects in Ontario that are also available for purchase.
The Company also owns a 13,000 hectare portfolio of base metal properties in the Bathurst Mining Camp (“BMC”) of New Brunswick that is subject to an option Agreement that gives Major Precious Metals Corp (SIZE) the right to earn 100% interest. Major Precious completed the prescribed 2nd anniversary payment of 1 million shares on February 22, 2021. SLAM retains a 2% Net Smelter Return royalty on the BMC claims.
SLAM also holds NSR royalties on the Superjack, Nash Creek and Coulee zinc‐lead‐copper‐silver properties in New Brunswick. Additional information about SLAM and its projects is available at www.slamexploration.com or from SEDAR filings at www.sedar.com. Follow us on twitter @SLAMGold.
Qualifying Statements: Mike Taylor P.Geo, President and CEO of SLAM Exploration Ltd., a qualified person as defined by National Instrument 43-101, approves the technical information contained in this news release. The assay numbers for soils rock and drill core noted above are derived from government files as well as data published by other companies and considered to be reliable.
Certain information in this press release may constitute forward-looking information, including statements that address the Private Placement, the closing of the Private Placement, future production, reserve potential, exploration and development activities and events or developments that the Company expects. This information is based on current expectations that are subject to significant risks and uncertainties that are difficult to predict. Actual results might differ materially from results suggested in any forward-looking statements. The Company assumes no obligation to update the forward-looking statements, or to update the reasons why actual results could differ from those reflected in the forward looking-statements unless and until required by securities laws applicable to the Company. There are a number of risk factors that could cause future results to differ materially from those described herein. Information identifying risks and uncertainties is contained in the Company's filings with the Canadian securities regulators, which filings are available at www.sedar.com. Neither the TSXV nor its Regulation Services Provider (as that term is defined in the policies of the TSXV) accepts responsibility for the adequacy or accuracy of this release.
CONTACT INFORMATION:
Mike Taylor, President & CEO
Contact: 506-623-8960 mike@slamexploration.com
Eugene Beukman, CFO
Contact: 604-687-2038 ebeukman@pendergroup.ca
THIS NEWS RLEASE IS NOT FOR DISTRIBUTION IN
THE UNITED STATES OR TO U.S. NEWS AGENCIES
VANCOUVER, British Columbia, April 06, 2021 (GLOBE NEWSWIRE) — Planet Ventures Inc. (TSX-V: PXI; FSE: P6U) (“Planet” or the “Company”) is pleased to announce that it’s UK-based gaming entertainment company, 1st11, has secured Brazilian international and Juventus soccer star Arthur Melo as its Global Ambassador.
1st11 delivers interactive gaming experiences working in collaboration with leading talent from the world of gaming, pro sports and esports. Facilitated by advanced proprietary mobile technology, fans can join in the action and play alongside their heroes in specially created formats across a wide range of the world’s most popular gaming titles.
1st11’s mission is to make competitive gaming more fun, inclusive, entertaining and scalable. Via a simple to use consumer app, casual gamers and esports enthusiasts alike will be able to seamlessly jump into a range of fun and exclusive formats designed in collaboration with world class talent. In doing so, fans can earn rewards and XP not just for winning but also for playing, sharing and engaging. A comprehensive rewards system enables users to redeem limited edition digital products, merchandise and exclusive one-of-a-kind experiences.
Arthur Melo comments: “I love 1st11’s vision. Its unique approach to enhancing the fan experience by bringing together gaming creators and sports stars into interactive formats is cool and unique. It brings gaming entertainment to the next level, allowing the real and the virtual worlds to collide in new and often unexpected ways.”
Leading the company’s brand positioning and design is Alexandre Gama, founder of Inovnation and former Global Chief Creative Officer of BBH. 1st11’s platform, unique in its inclusive ‘Fun Comes 1st’ approach, consists of three key components.
First is a consumer facing app, which is a fan’s passport to access exclusive experiences, challenges, benefits and rewards.
Second is a proprietary talent management platform, ‘1st11 Creators’. The talent facing app provides tools to creators and enables 1st11 to design gaming challenges collaborating with over 500 athletes at launch. ‘1st11 Creators’ also provides brand and rights holders with advanced analytics, reporting and full-service gaming solutions.
Third is a mobile optimised mobile web destination, 1st11fun.com which editorialises, supports and promotes exclusive content and challenges available within the app.
As part of the company’s continuing growth strategy, 1st11 has made a strategic investment into Latin America’s leading gaming entertainment business Final Level. Latin America is the fastest growing gaming market behind China & the USA and this investment provides a solid partnership delivering access to the most prolific creators and esports teams in the region.
The gaming industry has exploded with over 2.7 billion globally are now gamers. According to Forbes, the value of the video game industry will reach over $300 billion by 2025.
Christopher Glancy, 1st11’s Head of Product explains: “As growth in the gaming and esports sectors has become a global phenomenon, it is attracting superstar athletes with a passion for sharing experiences with an engaged audience of millions. Signing a culturally relevant icon such as Arthur Melo who has over 5 million followers on Instagram is very exciting. I look forward to working closely with him and the wider team to deliver a world class product for fans.”
Coming soon via the Apple App Store and Google Play, 1st11 will also launch a custom-built talent management platform 1st11 Creators. This will make it easy for 1st11 talent and rights holders to support proprietary formats. The platform centrally coordinates and assists influencer management while 1st11’s tech stack fully supports brands and rights holder partners to deliver scalable gaming experiences.
Flavio Maria, 1st11 COO adds: “The world of gaming presents diverse and largely untapped opportunities for brands and rights holders to engage with consumers. There are already over 500 professional athletes signed to 1st11’s Creator Network, with Arthur Melo joining our line-up of star-studded talent as the first in a series of global ambassadors. We look forward to welcoming brands and partners seeking an easier way to engage in scalable gaming activations”.
About Planet Ventures Inc.
Planet Ventures Inc. is an investment issuer listed on the TSX Venture Exchange, that is focused on investing in disruptive companies and industries that have high growth potential. Planet’s unique portfolio driven investment policies provide investors with access to emerging and high-growth opportunities while shielding them from any formidable downside.
For more information, please visit: https://planetventuresinc.com/
ON BEHALF OF THE BOARD
“Zula Kropivnitski”
Zula Kropivnitski
Chief Financial Officer and Director
INVESTOR RELATIONS CONTACT
PLANET VENTURES INC.
Tel: (604) 681-0084
Fax: (604) 681-0094
Email: info@planetventuresinc.com
CAUTIONARY STATEMENT ON FORWARD-LOOKING INFORMATION
This news release includes certain statements that may be deemed "forward-looking statements". All statements in this news release, other than statements of historical facts, that address events or developments that the Company expects to occur, are forward-looking statements. Forward-looking statements are statements that are not historical facts and are generally, but not always, identified by the words "expects", "plans", "anticipates", "believes", "intends", "estimates", "projects", "potential" and similar expressions, or that events or conditions "will", "would", "may", "could" or "should" occur. These statements include, but are not limited to, the expectation that Spin-Out Transaction may be effected. Although the Company believes the expectations expressed in such forward-looking statements are based on reasonable assumptions, such statements are not guarantees of future performance and actual results may differ materially from those in the forward-looking statements. Factors that could cause the actual results to differ materially from those in forward-looking statements include market prices, continued availability of capital and financing, and general economic, market or business conditions. Investors are cautioned that any such statements are not guarantees of future performance and actual results or developments may differ materially from those projected in the forward-looking statements. Forward-looking statements are based on the beliefs, estimates and opinions of the Company's management on the date the statements are made. Except as required by applicable securities laws, the Company undertakes no obligation to update these forward-looking statements in the event that management's beliefs, estimates, opinions, or other factors, should change.
Neither TSX Venture Exchange nor its Regulations Services Provider (as that term is defined in the policies of the TSX Venture Exchange) accepts responsibility for the adequacy or accuracy of this news release.
Vancouver, British Columbia–(Newsfile Corp. – April 6, 2021) – INCA ONE GOLD CORP. (TSXV: IO) (OTC Pink: INCAF) (FSE: SU92) ("Inca One" or the "Company") a gold producer operating two, fully permitted, mineral processing facilities in Peru, announces the change of its symbol from IO to INCA.
The common shares of the Company will begin trading under the new symbol "INCA" on the TSX Venture Exchange at market open on April 9, 2021. The CUSIP (45328X305) will remain the same.
About Inca One
Inca One Gold Corp is a TSXV listed, gold producer operating two, fully permitted, gold mineral processing facilities in Peru. The Company has produced in excess of 92,000 ounces of gold, generating over US$125 million in revenue from its first 6 years of operations. Inca One, is led by an experienced and capable management team that has established the Company as a trusted leader in servicing government permitted, small-scale miners in Peru. Peru is the world's seventh-largest producer of gold and its small-scale mining sector is estimated by government officials to be valued in the billions of dollars annually. Inca One possesses a combined 450 tonnes per day permitted operating capacity at its two fully integrated plants, Chala One and Kori One. To learn more visit www.incaone.com.
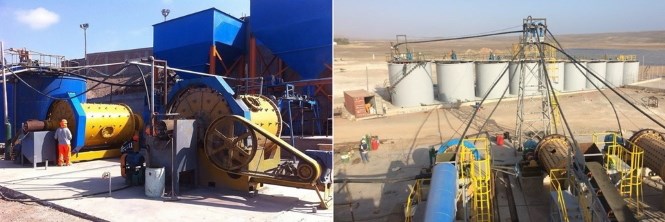
Figure 1. Inca One's gold processing facilities in Peru (left: Chala One facility; right: Kori One facility)
To view an enhanced version of Figure 1, please visit:
https://orders.newsfilecorp.com/files/2645/79639_bdd8593fe4915893_001full.jpg
On behalf of the Board,
Edward Kelly
President and CEO
Inca One Gold Corp.
For More Information Contact:
Konstantine Tsakumis
Inca One Gold Corp.
ktsakumis@incaone.com
604-568-4877
NEITHER THE TSX VENTURE EXCHANGE NOR ITS REGULATION SERVICES PROVIDER (AS THAT TERM IS DEFINED IN THE POLICIES OF THE TSX VENTURE EXCHANGE) ACCEPTS RESPONSIBILITY FOR THE ADEQUACY OR ACCURACY OF THIS NEWS RELEASE.
Statements regarding the Company which are not historical facts are "forward-looking statements" that involve risks and uncertainties. Such information can generally be identified by the use of forwarding-looking wording such as "may", "expect", "estimate", "anticipate", "intend", "believe" and "continue" or the negative thereof or similar variations. Since forward-looking statements address future events and conditions, by their very nature, they involve inherent risks and uncertainties. Actual results in each case could differ materially from those currently anticipated in such statements due to factors such as: (i) fluctuation of mineral prices; (ii) a change in market conditions; and (iii) the fact that future operational results may not be accurately predicted based on this limited information to date. Except as required by law, the Company does not intend to update any changes to such statements. Inca One believes the expectations reflected in those forward-looking statements are reasonable but no assurance can be given that these expectations will prove to be correct and such forward-looking statements included herein should not be unduly relied upon.
This press release shall not constitute an offer to sell or the solicitation of an offer to buy, nor shall there be any sale of these securities in any state in which such offer, solicitation, or sale would be unlawful prior to registration or qualification under the securities laws of any such state.

To view the source version of this press release, please visit https://www.newsfilecorp.com/release/79639
Montreal Quebec, April 06, 2021 (GLOBE NEWSWIRE) — Montreal, Quebec April 6, 2021 – SRG Mining Inc. (TSXV: SRG) (“SRG” or the “Company”) announced today that further to its press release dated January 26, 2021 announcing a private placement in the form of a convertible debt financing for USD$7.5M (approximately CAD$9.53M) (the “Financing”) with Sprott Private Resource Lending II (Collector), LP (“Sprott”), and the announcement of March 26, 2021 announcing the closing of the first tranche of the Financing for USD$800,000 which matured on April 2, 2021 (the “First Tranche”), the Company would like to provide a general update to the market.
Considering the Company’s current working capital needs, market conditions and SRG’s bid on the assets of North American Lithium Inc. (“NAL”), Sprott has agreed to refinance the First Tranche and replace it with a new secured credit agreement for USD$1.6M (the “USD$1.6M Note”) which was funded on the date hereof and represents a fresh cash injection of USD$800,000, as the balance will be used to refinance and replace the previously announced convertible financing under the First Tranche.
The USD$1.6M Note, includes a refinancing and a replacement of the previously announced USD$800,000 First Tranche, as well as a fresh cash injection on the same terms which are for the totality of the amount; (i) an interest rate of 8% per annum, (ii) a term expiring on July 31, 2023, (iii) is convertible into common shares of the Company, at the discretion of Sprott, at a conversion price equal to C$0.69 per share and (iv) includes the issuance of warrants as described herein.
Concurrently, the Company has issued transferable common share purchase warrants to Sprott exercisable for up to 2,913,623 common shares of the Company at C$0.69 per share until July 31, 2023. The above noted securities are subject to a four-month hold period.
As for the Financing announced on January 26, 2021, the parties continue to finalize the terms and conditions of the Financing, including the conversion price. The Financing and the USD1.6M Note (as it concerns the refinancing of the First Tranche and the new cash injection) remain subject to applicable rules and approvals of the TSX Venture Exchange (the “TSXV”).
About SRG Mining
SRG Mining is a Canadian-based mining company focused on developing the Lola graphite deposit located in the Republic of Guinea, West Africa. SRG is committed to operating in a socially, environmentally, and ethically responsible manner.
For additional information, please visit SRG’s website at www.srgmining.com.
Contact :
Benoit La Salle, FCPA FCA
Email: benoit.lasalle@srgmining.com
Neither the TSXV nor its Regulation Services Provider (as that term is defined in the policies of the TSXV) accepts responsibility for the adequacy or accuracy of this release.
Forward-Looking Statements
This press release contains "forward-looking information" within the meaning of Canadian securities legislation. All information contained herein that is not clearly historical in nature may constitute forward-looking information. Generally, such forward-looking information can be identified by the use of forward-looking terminology such as “firm”, “anticipated”, “potential”, “will”, “continue”, “demonstrate”, “deliver”, “believe”, or variations of such words and phrases or state that certain actions, events or results "may", "could", "would" or "might". Forward-looking information is subject to known and unknown risks, uncertainties and other factors that may cause the actual results, level of activity, performance or achievements of the Company to be materially different from those expressed or implied by such forward-looking information, including but not limited to: (i) volatile stock price; (ii) the general global markets and economic conditions; (iii) the possibility of write-downs and impairments; (iv) the risk associated with exploration, development and operations of mineral deposits and mine plans for the Company’s mining operations; (v) the risk associated with establishing title to mineral properties and assets including permitting, development, operations and production from the Company’s operations being consistent with expectations and projections; (vi) fluctuations in commodity prices, finding offtake takers and potential clients or enforcing such agreements against same and other risks and factors described or referred to in the section entitled "Risk Factors" in the MD&A of the Company and which is available at www.sedar.com, all of which should be reviewed in conjunction with the information found in this news release.
Although the Company has attempted to identify important factors that could cause actual results to differ materially from those contained in the forward-looking information, there may be other factors that cause results not to be as anticipated, estimated or intended. There can be no assurance that such forward-looking information will prove to be accurate, as actual results and future events could differ materially from those anticipated in such forward-looking information. Such forward-looking information has been provided for the purpose of assisting investors in understanding the Company's business, operations and exploration plans and may not be appropriate for other purposes. Accordingly, readers should not place undue reliance on forward-looking information. Forward-looking information is given as of the date of this press release, and the Company does not undertake to update such forward-looking information except in accordance with applicable securities laws.
CONTACT: Kathleen Jones-Bartels SRG Mining 16043417474 Kathleen.bartels@srgmining.com
VANCOUVER, BC / ACCESSWIRE / April 6, 2021 / GGL Resources Corp. (TSXV:GGL) ("GGL" or the "Company") is pleased to announce the results of underground sampling conducted in early December at its past-producing Gold Point mesothermal gold/silver project, located in the Walker Lane Trend, southwestern Nevada.
The sampling was completed on the 100 through 500 levels at the Great Western Mine, one of the two main former producers on the Gold Point property.
Highlights from underground sampling include:
-
23.0 g/t gold and 76 g/t silver over 1.30 m from the 500' Level;
-
7.48 g/t gold and 64.3 g/t silver over 1.58 m from the 200' Level;
-
6.87 g/t gold and 40.4 g/t silver over 1.63 m from the 500' Level;
-
6.65 g/t gold and 29.5 g/t silver over 1.94 m from the 500' Level;
-
5.99 g/t gold and 73.3 g/t silver over 1.75 m from the 500' Level; and,
-
3.57 g/t gold and 367 g/tsilver over 1.00 m from the 300' Level.
Thirty of the 167 chip samples collected returned greater than 3 g/t gold equivalent, with 89 yielding greater than 1 g/t gold equivalent. The main drifts follow what appears to be a post- or syn-mineralization fault. Other parallel drifts on the 200' and 500' Levels follow a vein in the hanging wall of the main fault. Historical production was primarily focused on mineralized shoots within the main fault, above the 300' Level. There is no historical production record from the 500' Level or lower.
The following table lists chip samples grading greater than 3 g/t gold equivalent collected from the Great Western Mine.
|
Level |
Station |
Width (m) |
Gold (g/t) |
Silver (g/t) |
Gold Equivalent* (g/t) |
|
100 |
100-18 |
1.22 |
0.64 |
247 |
4.17 |
|
200 |
200-01 |
2.27 |
0.75 |
456 |
7.26 |
|
200 |
Including |
1.22 |
1.06 |
647 |
10.30 |
|
200 |
200-17 |
1.12 |
1.73 |
142 |
3.76 |
|
200 |
200-22 |
1.36 |
3.76 |
61.4 |
4.64 |
|
200 |
200-23 |
1.08 |
4.63 |
49.3 |
5.33 |
|
200 |
200-24 |
1.58 |
7.48 |
64.3 |
8.40 |
|
200 |
200-28 |
1.86 |
5.50 |
48.2 |
6.19 |
|
200 |
200-43 |
2.25 |
2.81 |
145 |
4.88 |
|
300 |
300-42 |
1.18 |
3.67 |
32.1 |
4.13 |
|
300 |
300-49 |
1.00 |
3.57 |
367 |
8.81 |
|
300 |
300-50 |
1.40 |
3.24 |
222 |
6.41 |
|
500 |
500-02 |
1.45 |
5.88 |
47.7 |
6.56 |
|
500 |
500-09 |
1.00 |
2.38 |
190 |
5.09 |
|
500 |
500-26 |
1.94 |
6.65 |
29.5 |
7.07 |
|
500 |
500-29 |
1.75 |
5.99 |
73.3 |
7.04 |
|
500 |
Including |
0.77 |
11.95 |
97 |
13.34 |
|
500 |
500-31 |
1.63 |
6.87 |
40.4 |
7.45 |
|
500 |
500-32 |
2.00 |
4.53 |
16.4 |
4.76 |
|
500 |
Including |
1.30 |
6.68 |
22.2 |
7.00 |
|
500 |
500-37 |
1.30 |
23.00 |
76.4 |
24.09 |
|
500 |
500-40 |
0.76 |
9.27 |
23.4 |
9.60 |
*Gold Equivalent was calculated using a 70:1 silver to gold ratio based on current metal prices and assume 100% recovery of both metals.
Program Update:
Drilling
A reverse-circulation (RC) drill program is currently underway at the Gold Point property. A total of 2,085 metres of drilling in ten holes have been completed. The drilling is testing near to and along strike of known mineralization at the Great Western Mine. The current drill program is anticipated to include 3,000 m of drilling in up to 18 holes.
Tailings
In October 2020, twenty-five representative samples were collected from the main past production tailings storage area and, another six samples collected from a smaller secondary area. Samples collected from the main tailings storage area returned 0.286 g/t gold to 3.62 g/t gold (averaging 1.04 g/t gold), with samples collected from the secondary storage area ranging from 1.645 g/t gold to 27.4 g/t gold (averaging 2.62 g/t gold excluding the highest grade sample).
Systematic hand-auger sampling of both tailings storage facilities has now been completed. A total of 82 samples were collected on a 20 metre grid. Auger samples taken from the main storage area, which covers an approximate area of 13,000 m2, had depths ranging from 0.23 m to 4.57 m, and averaged 1.78 m. In the older storage area, which covers an approximate area of 11,000 m2, depths ranged from 0.18 m to 1.2 m, and averaged 0.55 m.
Soil Sampling
Grid soil sampling was recently completed across the eastern portion of the property where alluvium covers the inferred extension of the structural corridor hosting the gold-silver bearing veins of the main workings. A total of 529 soil samples were collected every 25 m along lines spaced 100 m apart. This geochemical survey is primarily targeting the more mobile pathfinder elements.
Next Steps
Current program samples are being delivered to the analytical laboratory on an ongoing basis. Results will be announced upon receipt and QA/QC verification.
Once all results of the current drilling and sampling program are received, they will be used to design and permit a more aggressive surface drill program. Necessary repairs, safety modifications, and permitting to the Great Western Mine will continue in order for underground exploration, including long hole drilling, to be performed. Preparations and discussions with the relevant authorities are underway to repair the shafts of the Orleans Mine so that those workings can also be accessed, sampled and mapped.
About the Great Western Mine
The Great Western was located in 1905 and first mined in 1907. A mill was built next to the main shaft in 1913, and the mine continued to operate intermittently until the mid-1930s. Ohio Mining Company bought the mine in 1935 to gain access to the mill to process ore from their nearby Orleans Mine, the other former producing mine on the Gold Point property. Following the sale, no large-scale production is known to have occurred at the Great Western Mine. The mines at Gold Point were leased to U.S. Milling and Minerals Co. ("USM&M") between 1958 and 1962, which focused primarily on the adjacent Orleans Mine. Their plan was to connect the Orleans and Great Western mines at the 1,000' level. Although they did not complete this plan, they did perform significant rehabilitation on the Great Western Mine in preparation. All of USM&M's operations abruptly ceased in 1962 due to corporate issues related to another nearby mine. The last known rehabilitation and exploration work on the Great Western Mine occurred in the mid 1980's and was conducted by Fisher-Watt Mining Co. Inc. and their successor.
About Gold Point
The Gold Point project is accessible via highway 774 and serviced by electricity. It hosts a camp-scale precious metal system that consists of numerous gold and silver rich quartz veins. These high-grade veins are typically 1 to 2 m in width and locally up to 7 m wide. Two veins (Orleans and Great Western) were intermittently mined from the 1880s through to the early 1960s. Existing underground workings are mostly open and are dry to approximately 275 m below surface on the Orleans Vein (1020 ft level) and 240 m on the Great Western Vein, (960 ft level). Historical records indicate that the mines had high cut-off grades (about 10 g/t gold), suggesting that well mineralized areas likely remain in un-mined portions of the developed workings. This assumption is further supported by a report that describes 35 historical samples collected post-mining across the Orleans Vein from the 960 ft to 1020 ft levels, which averaged 0.389 opt (13.3 g/t) gold including a vein on the 1000 ft level that returned 7.97 opt (273.2 g/t) gold over 0.5 m. Additionally, 21 samples from the 600 ft to 1020 ft levels reportedly averaged 0.314 opt (10.77 g/t) gold. Historical records indicate that approximately 74,000 ounces were produced from the Orleans and Great Western Mines, with recoveries of 92% to 98% for gold through cyanidation.
All analyses were performed by ALS Minerals in Reno, Nevada. All samples were routinely analyzed for gold by a 50 g fire assay followed by atomic absorption (Au-AA26) and 48 elements by inductively coupled plasma-mass spectrometry (ME-MS61).
Technical information in this news release has been reviewed and approved by Matthew R. Dumala, P.Eng., a geological engineer with Archer, Cathro & Associates (1981) Limited and a qualified person for the purposes of National Instrument 43-101.
About GGL Resources Corp.
GGL is a seasoned, Canadian-based junior exploration company, focused on the exploration and advancement of under evaluated mineral assets in politically stable, mining friendly jurisdictions. The Company has recently acquired an option on the Gold Point project in the prolific Walker Lane Trend, Nevada, which consolidated several gold-silver veins, two of which were past producing high-grade mines. The Company also holds the McConnell gold-copper project located 22 kilometers southeast of the Kemess Mine in north-central BC, and promising diamond exploration projects in Nunavut and the Lac de Gras diamond district of the Northwest Territories. Lac de Gras is home to Canada's first two diamond mines, the world class Diavik and Ekati mines discovered in the 1990s. GGL also holds diamond royalties on mineral leases in close proximity to the Gahcho Kué diamond mine in the Northwest Territories.
ON BEHALF OF THE BOARD
"David Kelsch"
David Kelsch
President, COO and Director
For further information concerning GGL Resources Corp. or its various exploration projects please visit our website or contact:
Investor Inquiries
Richard Drechsler
Corporate Communications
Tel: (604) 687-2522
NA Toll-Free: (888) 688-2522
rdrechsler@strategicmetalsltd.com
Corporate Information
Linda Knight
Corporate Secretary
Tel: (604) 688-0546
info@gglresourcescorp.com
Neither the TSX Venture Exchange nor its Regulation Services Provider (as that term is defined in the policies of the TSX Venture Exchange) accepts responsibility for the adequacy or accuracy of this release.
This news release may contain forward-looking statements based on assumptions and judgments of management regarding future events or results that may prove to be inaccurate as a result of exploration and other risk factors beyond its control, and actual results may differ materially from the expected results.
SOURCE: GGL Resources Corp.
View source version on accesswire.com:
https://www.accesswire.com/639020/GGL-Resources-Corp-Announces-Results-from-Underground-Sampling-at-Gold-Point-Nevada
Toronto, Ontario–(Newsfile Corp. – April 6, 2021) – Crown Mining Corporation (TSXV: CWM) (FSE: C73) ("Crown" or the "Company") is pleased to announce that it has completed the change of its name to US Copper Corp. The name change will take effect when stock markets open to trade on April 8, 2021. The common shares will trade on the TSX Venture Exchange under the new ticker symbol "USCU". The new CUSIP for the Company's common shares is 91735Y107.
Accordingly, on April 8, 2021, our internet domain name will change to www.uscoppercorp.com. Visitors to our current website address, and communication to our current electronic mail addresses, will be redirected to our new site.
Steve Dunn, President, CEO and director said, "April 8, 2021 is an important day in our evolution as we change our name to US Copper Corp to reflect the location of our major asset, the Moonlight-Superior Copper Project in North-East California and our confidence in Plumas County, California as a supportive mining jurisdiction. Our new name also highlights our company as potential beneficiaries of the U.S. government's strategy to focus on domestic supply of critical minerals, broadening our appeal to U.S. investors."
About Crown Mining Corp.
Crown controls approximately 15 square miles of patented and unpatented federal mining claims in the Light's Creek Copper District in Plumas County, NE California; essentially, the entire District. The District contains substantial copper (silver) sulfide and copper oxide resources in three deposits – Moonlight, Superior and Engels, as well as several partially tested and untested exploration targets.
The Superior and Engels Mines operated from about 1915-1930 producing over 161 million pounds of copper from over 4 million tons of rock containing 2.2% copper with silver and gold credits.
The Moonlight Deposit was discovered and drilled by Placer Amex during the 1960's. Details of the resources on Crown's property and the parameters used to calculate them can be found in the "Technical Report and Preliminary Economic Assessment for the Moonlight Deposit, Moonlight-Superior Copper Project, California, USA" dated April 12, 2018 on both the company's website at www.crownminingcorp.com or on www.sedar.com under the Crown Mining Corp profile.
Mr. George Cole is the Qualified Person pursuant to NI 43-101 responsible for the technical information contained in this news release, and he has reviewed and approved this news release.
For Further Information Contact:
Mr. Stephen Dunn, President, CEO and Director, US Copper Corp (416) 361-2827 or email info@uscoppercorp.com.
Neither the TSX Venture Exchange nor its Regulation Services Provider (as that term is defined in the policies of the TSX Venture Exchange) accepts responsibility for the adequacy or accuracy of this press release.
This press release contains forward-looking statements within the meaning of applicable Canadian and U.S. securities laws and regulations, including statements regarding the future activities of the Company. Forward-looking statements reflect the current beliefs and expectations of management and are identified by the use of words including "will", "hopes", "anticipates", "expected to", "plans", "planned" and other similar words. Actual results may differ significantly. The achievement of the results expressed in forward-looking statements is subject to a number of risks, including those described in the Company's management discussion and analysis as filed with the Canadian securities regulatory authorities which are available at www.sedar.com. Investors are cautioned not to place undue reliance upon forward-looking statements.

To view the source version of this press release, please visit https://www.newsfilecorp.com/release/79582
Copper futures for May delivery gained 2.3% to $4.1375 per pound — a level last seen in mid-March — courtesy of upbeat services PMI data and better-than-expected nonfarm payrolls numbers, which have been fueling optimism regarding a robust US economic growth this year. Meanwhile, the decision by Chile — the world’s top exporter of the metal — to close its borders during April due to a spike in COVID-19 cases has led to supply concerns. So far this year, copper prices have gained 16% owing to accelerating demand for the red metal on account of pick up in manufacturing activity, particularly in China.
The IHS Markit US Services PMI came in at 60.4 in March 2021, higher than 59.8 in February — the fastest output growth since July 2014. New business expanded the most in six years, reflecting strengthening client demand amid easing of virus containment restrictions in some states. According to the latest Labor Department report, total nonfarm payroll employment rose by 916,000 in March and the unemployment rate fell to 6.0%, reflecting the resumption of economic activity that had been thwarted by the pandemic. In the United States, there has been a noted expansion in manufacturing activity over the past 10 months. The Caixin China General Manufacturing PMI has remained above 50 since May last year, denoting expansion. Meanwhile, the IHS Markit Eurozone Manufacturing PMI has also trended above 50 since July last year. This pickup in manufacturing activity worldwide bodes well for copper demand.
Chile closed its borders in April in an effort to counter the rise in coronavirus cases as it seeks to accelerate its vaccination campaign. Notably, the country’s reported infections have crossed the 1 million mark. The stepped-up border restrictions may disrupt mining activities by delaying equipment replacement. Notably, supplies from two major producers Chile and Peru, which together account for about 40% of world copper production, have been volatile due to the impact of the coronavirus pandemic. While Chile's copper output decreased 1% in 2020, production in Peru fell 12.5%. The unrelenting nature of the pandemic remains a persistent threat to copper miners. Nevertheless, this demand-supply imbalance will prop up copper prices, which bodes well for miners.
The long-term outlook for copper remains positive as demand is anticipated to improve on investments in electric vehicles and renewable energy, and infrastructure. Meanwhile, grade decline, rising input costs, water constraints and scarcity of high-quality future development opportunities continue to constrain the industry’s supply. Notably, miners are now committed to cost-reduction strategies and digital innovation to drive operating efficiencies, which will aid margins in the long haul.

Copper miners fall under the Zacks Mining – Non Ferrous industry, which has gained 68.8% in the past six months compared with the S&P 500’s rally of 18.6%. The industry falls under the broader Basic Materials sector, which increased 30.3%. The industry currently carries a Zacks Industry Rank #97, which places it at the top 37% of 256 Zacks industries. Our research shows that the top 50% of the Zacks-ranked industries outperform the bottom 50% by a factor of more than 2 to 1.
Per the latest Earnings Trends, after remaining in the red for the past four quarters, the Basic Materials sector returned to growth with an earnings improvement of 28.1% in fourth-quarter 2020. The sector is expected to witness growth of 66.4% in earnings in first-quarter 2020, followed by 162.2%, 48.8% and 11.8% in the second, third and fourth quarters, respectively. The prospects for 2021 look promising for the sector with an impressive earnings growth projection of 58.4%.
5 Copper Stocks to Watch
We suggest investors to keep an eye on these five copper-mining stocks that we have handpicked. Notably, each of these stocks have a Zacks Rank #1 (Strong Buy), 2 (Buy) or 3 (Hold), and outperformed both the sector’s and S&P 500’s rally of 33.1% and 20.6%, respectively. This is shown in the chart below. These stocks are anticipated to carry the momentum forward backed by their earnings growth projections.

BHP Group BHP: Headquartered in Melbourne, Australia, BHP Group engages in exploration, development, and production of oil and gas properties; and mining of copper, silver, zinc, molybdenum, uranium, gold, iron ore, and metallurgical and energy coal.
The company has four major projects under development in petroleum, copper, iron ore and potash with a combined budget of $8.5 billion over the life of the projects, which will drive growth in the long run. Efforts to make operations more efficient through smarter technology adoption across the entire value chain will continue to aid in reducing costs, thereby boosting the company’s margins. Its focus on lowering debt will also contribute to growth.
The company has a long-term estimated earnings growth rate of 4%. The Zacks Consensus Estimate for the company’s fiscal 2021 earnings suggests year-over-year growth of 77%. The estimate has been revised upward by 19% over the past 90 days. The stock flaunts a Zacks Rank #1. Its shares have climbed 41% in the past six months.
Rio Tinto plc RIO: Headquartered in London, the U.K., Rio Tinto engages in mining of aluminum, silver, molybdenum, copper, diamonds, gold, borates, titanium dioxide, salt, iron ore, and uranium.
The company’s world-class portfolio of high-quality assets and strong balance sheet positions it well to navigate through these turbulent times. Rio Tinto’s disciplined capital allocation supports its ability to sustain production, increase investment in development projects (in high-return iron ore and copper), while delivering superior returns to shareholders. Notably, its copper projects at Resolution (Arizona) and Winu (Western Australia) offer significant growth prospects.
The Zacks Consensus Estimate for fiscal 2021 earnings indicates year-over-year improvement of 75%. The estimate has been revised upward by 53% over the past 90 days. The company sports a Zacks Rank #1. Over the past six months, the company’s shares have gained 34%.
Southern Copper Corporation SCCO: This company based in Phoenix, AZ engages in mining, exploring, smelting, and refining copper and other minerals.
The company has the largest copper reserves in the industry and operates high-quality, world-class assets. Its constant focus on increasing low-cost production is commendable. The company will benefit from its efforts to grow in Peru given that the country is currently the second largest producer of copper globally and holds 13% of the world’s copper reserves. It has growth projects on track that will help achieve its target of producing 1.9 million tons of copper production by 2028.
The Zacks Consensus Estimate for the company’s earnings in 2021 suggests year-over-year growth of 66%. The estimate has moved north by 29% in 90 days’ time. It has a long-term estimated earnings growth rate of 17.8%. The company’s shares have appreciated 57.2% in the past six months. It currently has a Zacks Rank #1. You can see the complete list of today’s Zacks #1 Rank stocks here.
Freeport-McMoRan Inc. FCX: This Phoenix, AZ-based company is engaged in mineral exploration and development; mining and milling of copper, gold, molybdenum and silver; and smelting and refining of copper concentrates.
Freeport is conducting exploration activities near existing mines with focus on opportunities to expand reserves. The company will benefit from ongoing large-scale concentrator expansion project at Cerro Verde that will provide incremental annual production of around 600 million pounds of copper and 15 million pounds of molybdenum. It recently completed the Lone Star copper leach project and is on track to produce around 200 million pounds of copper annually. The company is looking to advance studies for potential expansions and long-term development options for its large-scale sulfide resources at Lone Star. The company's effective cost management and efforts to reduce debt levels appear encouraging.
The Zacks Consensus Estimate for earnings for fiscal 2021 indicates year-over-year improvement of 365%. The estimate has been revised upward by 32% over the past 90 days. Shares of the company has soared 125% over the past six months. It has a Zacks Rank #3 and a long-term estimated earnings growth rate of 26.6%.
Kaz Minerals plc KZMYY: This U.K.-based company and its subsidiaries engage in mining and processing copper and other metals (gold, silver, zinc) primarily in Kazakhstan and Kyrgyzstan.
The company is well-poised to grow on the back of its large scale, low cost open copper pit mines. Its constant focus on implementing modern technology to develop deposits has aided it in building a portfolio of highly profitable mines with low operating costs. The Aktogay expansion project, which is anticipated to commence production in late 2021, is expected to boost the company’s copper production by 80,000 tons from 2022-27 and 60,000 tons thereafter. The bankable feasibility study for the Baimskaya copper project is estimated to be completed in the first half of 2021. Baimskaya is one of the world’s largest undeveloped copper resources with the potential to be a large scale, low cost open pit copper mine.
The Zacks Consensus Estimate for the company’s earnings for 2021 has moved up 47% over the past 90 days. Its shares have soared 86% in the past six months. The stock has a Zacks Rank #2.
Zacks Top 10 Stocks for 2021
In addition to the stocks discussed above, would you like to know about our 10 best buy-and-hold tickers for the entirety of 2021?
Last year's 2020 Zacks Top 10 Stocks portfolio returned gains as high as +386.8%. Now a brand-new portfolio has been handpicked from over 4,000 companies covered by the Zacks Rank. Don’t miss your chance to get in on these long-term buys.
Access Zacks Top 10 Stocks for 2021 today >>
Want the latest recommendations from Zacks Investment Research? Today, you can download 7 Best Stocks for the Next 30 Days. Click to get this free report
BHP Group Limited Sponsored ADR (BHP) : Free Stock Analysis Report
FreeportMcMoRan Inc. (FCX) : Free Stock Analysis Report
Southern Copper Corporation (SCCO) : Free Stock Analysis Report
Kaz Minerals PLC (KZMYY) : Free Stock Analysis Report
To read this article on Zacks.com click here.
Individual and institutional investors as well as advisors are invited to log-on to VirtualInvestorConferences.com to view presentations
NEW YORK, April 5, 2021 /PRNewswire/ — Virtual Investor Conferences, the leading proprietary investor conference series today announced that the presentations from the March Extractive Industry lnvestor Conference are now available for on-demand viewing.

REGISTER OR LOGIN NOW TO VIEW THE PRESENTATIONS: https://bit.ly/2PllJGf
The company presentations will be available 24/7 for 90 days. Investors, advisors and analysts may download shareholder materials from the "virtual trade booth" for the next three weeks.
Participating Companies:
|
Presentation |
Ticker(s) |
|
Keynote Presentation: By-Passing China in the Economic Recovery Christopher Ecclestone, Mining Strategist Hallgarten & Co. |
|
|
Appia Energy Corp. |
(OTCQB: APAAF | CSE: API) |
|
Osisko Metals Inc. |
(OTCQX: OMZNF | TSX-V: OM) |
|
Nova Royalty Corp. |
(OTCQB: NOVRF | TSX-V: NOVR) |
|
Northern Minerals Ltd. |
(Pink: NMEX | ASX: NTU) |
|
Luncheon Speaker: Can Critical Metal Supply Chains be Economically Constructed in the Free World? Jack Lifton, Founder, Technology Metals Research |
|
|
Energy Fuels Inc. |
(NYSE American: UUUU | TSX: EFR) |
|
Vision Lithium Inc. |
(OTCQB: ABEPF | TSX-V: VLI) |
|
Electric Royalties, Ltd. |
(Pink: ELECF | TSX-V: ELEC) |
|
Intercontinental Gold and Metals Ltd. |
(TSX-V: ICAU) |
|
Canada Silver Cobalt Works Inc. |
(OTCQB: CCWOF | TSX-V: CCW) |
|
Renforth Resources Inc. – Nickel/Surimeau |
(OTCQB: RFHRF | CSE: RFR) |
|
Thor Mining PLC |
(OTCQB: THORF | ASX: THR | AIM: THR) |
|
Vital Metals Ltd. |
(Pink: VTMXF | ASX: VML) |
|
Lake Resources NL |
(OTCQB: LLKKF | ASX: LKE) |
|
Keynote Presentation: The Outlook for Precious Metals Prices Jeffrey M. Christian, Managing Partner CPM Group |
|
|
Amex Exploration Inc. |
(OTCQX: AMXEF |TSX-V: AMX) |
|
Bonterra Resources Inc. |
(OTCQX: BONXF | TSX-V: BTR) |
|
Vanstar Mining Resources, Inc. |
(Pink: VMNGF | TSX-V: VSR) |
|
Signature Resources Ltd. |
(OTCQB: SGGTF | TSX-V: SGU) |
|
Luncheon Speaker: Silver: The Technometal New Demand, New Policy, New Future Phillips S. Baker, Jr., President & CEO of Hecla Mining |
|
|
VanGold Mining Corp. |
(OTC VGLDF |TSX-V: VGLD) |
|
Golden Valley Mines Ltd. |
(OTCQX: GLVMF | TSX-V: GZZ) |
|
Renforth Resources Inc. – Gold/Parbec |
(OTCQB: RFHRF | CSE: RFR) |
|
Trillium Gold Mines Inc. |
(OTCQX: TGLDF | TSX-V: TGM) |
|
Aztec Minerals Corp. |
(OTCQB: AZZTF | TSX-V: AZT) |
|
Prosper Gold Corp. |
(OTCQX: PGXFF | TSX-V: PGX) |
|
Silver Bullet Mines, Inc. |
|
|
Honey Badger Silver Inc. |
(Pink: HBEIF | TSX-V: TUF) |
|
Fabled Silver Gold Corp |
(OTCQX: FBSGF | TSX-V: FCO) |
To facilitate investor relations scheduling, for more information about the program and to view a complete calendar of Virtual Investor Conferences, please visit www.virtualinvestorconferences.com.
About Virtual Investor Conferences®
Virtual Investor Conferences (VIC) is the leading proprietary investor conference series that provides an interactive forum for publicly-traded companies to meet and present directly with investors.
A real-time solution for investor engagement, Virtual Investor Conferences is part of OTC Market Group's suite of investor relations services specifically designed for more efficient Investor Access. Replicating the look and feel of on-site investor conferences, Virtual Investor Conferences combine leading-edge conferencing and investor communications capabilities with a comprehensive global investor audience network.

View original content to download multimedia:http://www.prnewswire.com/news-releases/global-metals–mining-investor-conference-presentations-now-available-for-on-demand-viewing-301261241.html
SOURCE VirtualInvestorConferences.com
Today we'll do a simple run through of a valuation method used to estimate the attractiveness of Iluka Resources Limited (ASX:ILU) as an investment opportunity by taking the expected future cash flows and discounting them to their present value. We will take advantage of the Discounted Cash Flow (DCF) model for this purpose. Believe it or not, it's not too difficult to follow, as you'll see from our example!
Companies can be valued in a lot of ways, so we would point out that a DCF is not perfect for every situation. If you still have some burning questions about this type of valuation, take a look at the Simply Wall St analysis model.
See our latest analysis for Iluka Resources
Crunching the numbers
We use what is known as a 2-stage model, which simply means we have two different periods of growth rates for the company's cash flows. Generally the first stage is higher growth, and the second stage is a lower growth phase. In the first stage we need to estimate the cash flows to the business over the next ten years. Where possible we use analyst estimates, but when these aren't available we extrapolate the previous free cash flow (FCF) from the last estimate or reported value. We assume companies with shrinking free cash flow will slow their rate of shrinkage, and that companies with growing free cash flow will see their growth rate slow, over this period. We do this to reflect that growth tends to slow more in the early years than it does in later years.
A DCF is all about the idea that a dollar in the future is less valuable than a dollar today, so we need to discount the sum of these future cash flows to arrive at a present value estimate:
10-year free cash flow (FCF) forecast
|
2021 |
2022 |
2023 |
2024 |
2025 |
2026 |
2027 |
2028 |
2029 |
2030 |
|
|
Levered FCF (A$, Millions) |
-AU$49.4m |
AU$318.0m |
AU$316.8m |
AU$317.9m |
AU$320.6m |
AU$324.4m |
AU$329.0m |
AU$334.3m |
AU$340.1m |
AU$346.3m |
|
Growth Rate Estimate Source |
Est @ -1.4% |
Analyst x1 |
Est @ -0.38% |
Est @ 0.34% |
Est @ 0.84% |
Est @ 1.19% |
Est @ 1.44% |
Est @ 1.61% |
Est @ 1.73% |
Est @ 1.81% |
|
Present Value (A$, Millions) Discounted @ 7.7% |
-AU$45.9 |
AU$274 |
AU$254 |
AU$236 |
AU$221 |
AU$208 |
AU$196 |
AU$185 |
AU$175 |
AU$165 |
("Est" = FCF growth rate estimated by Simply Wall St)
Present Value of 10-year Cash Flow (PVCF) = AU$1.9b
The second stage is also known as Terminal Value, this is the business's cash flow after the first stage. For a number of reasons a very conservative growth rate is used that cannot exceed that of a country's GDP growth. In this case we have used the 5-year average of the 10-year government bond yield (2.0%) to estimate future growth. In the same way as with the 10-year 'growth' period, we discount future cash flows to today's value, using a cost of equity of 7.7%.
Terminal Value (TV)= FCF2030 × (1 + g) ÷ (r – g) = AU$346m× (1 + 2.0%) ÷ (7.7%– 2.0%) = AU$6.2b
Present Value of Terminal Value (PVTV)= TV / (1 + r)10= AU$6.2b÷ ( 1 + 7.7%)10= AU$3.0b
The total value, or equity value, is then the sum of the present value of the future cash flows, which in this case is AU$4.8b. The last step is to then divide the equity value by the number of shares outstanding. Compared to the current share price of AU$7.3, the company appears quite good value at a 36% discount to where the stock price trades currently. The assumptions in any calculation have a big impact on the valuation, so it is better to view this as a rough estimate, not precise down to the last cent.

Important assumptions
We would point out that the most important inputs to a discounted cash flow are the discount rate and of course the actual cash flows. You don't have to agree with these inputs, I recommend redoing the calculations yourself and playing with them. The DCF also does not consider the possible cyclicality of an industry, or a company's future capital requirements, so it does not give a full picture of a company's potential performance. Given that we are looking at Iluka Resources as potential shareholders, the cost of equity is used as the discount rate, rather than the cost of capital (or weighted average cost of capital, WACC) which accounts for debt. In this calculation we've used 7.7%, which is based on a levered beta of 1.087. Beta is a measure of a stock's volatility, compared to the market as a whole. We get our beta from the industry average beta of globally comparable companies, with an imposed limit between 0.8 and 2.0, which is a reasonable range for a stable business.
Moving On:
Whilst important, the DCF calculation is only one of many factors that you need to assess for a company. It's not possible to obtain a foolproof valuation with a DCF model. Instead the best use for a DCF model is to test certain assumptions and theories to see if they would lead to the company being undervalued or overvalued. For example, changes in the company's cost of equity or the risk free rate can significantly impact the valuation. Why is the intrinsic value higher than the current share price? For Iluka Resources, we've put together three essential elements you should further examine:
-
Financial Health: Does ILU have a healthy balance sheet? Take a look at our free balance sheet analysis with six simple checks on key factors like leverage and risk.
-
Management:Have insiders been ramping up their shares to take advantage of the market's sentiment for ILU's future outlook? Check out our management and board analysis with insights on CEO compensation and governance factors.
-
Other Solid Businesses: Low debt, high returns on equity and good past performance are fundamental to a strong business. Why not explore our interactive list of stocks with solid business fundamentals to see if there are other companies you may not have considered!
PS. The Simply Wall St app conducts a discounted cash flow valuation for every stock on the ASX every day. If you want to find the calculation for other stocks just search here.
This article by Simply Wall St is general in nature. It does not constitute a recommendation to buy or sell any stock, and does not take account of your objectives, or your financial situation. We aim to bring you long-term focused analysis driven by fundamental data. Note that our analysis may not factor in the latest price-sensitive company announcements or qualitative material. Simply Wall St has no position in any stocks mentioned.
Have feedback on this article? Concerned about the content? Get in touch with us directly. Alternatively, email editorial-team (at) simplywallst.com.
To find a multi-bagger stock, what are the underlying trends we should look for in a business? Firstly, we'd want to identify a growing return on capital employed (ROCE) and then alongside that, an ever-increasing base of capital employed. Put simply, these types of businesses are compounding machines, meaning they are continually reinvesting their earnings at ever-higher rates of return. So when we looked at Energy Resources of Australia (ASX:ERA) and its trend of ROCE, we really liked what we saw.
Return On Capital Employed (ROCE): What is it?
Just to clarify if you're unsure, ROCE is a metric for evaluating how much pre-tax income (in percentage terms) a company earns on the capital invested in its business. To calculate this metric for Energy Resources of Australia, this is the formula:
Return on Capital Employed = Earnings Before Interest and Tax (EBIT) ÷ (Total Assets – Current Liabilities)
0.013 = AU$9.7m ÷ (AU$1.0b – AU$229m) (Based on the trailing twelve months to December 2020).
So, Energy Resources of Australia has an ROCE of 1.3%. Even though it's in line with the industry average of 1.3%, it's still a low return by itself.
See our latest analysis for Energy Resources of Australia

While the past is not representative of the future, it can be helpful to know how a company has performed historically, which is why we have this chart above. If you're interested in investigating Energy Resources of Australia's past further, check out this free graph of past earnings, revenue and cash flow.
The Trend Of ROCE
Like most people, we're pleased that Energy Resources of Australia is now generating some pretax earnings. Historically the company was generating losses but as we can see from the latest figures referenced above, they're now earning 1.3% on their capital employed. At first glance, it seems the business is getting more proficient at generating returns, because over the same period, the amount of capital employed has reduced by 20%. This could potentially mean that the company is selling some of its assets.
For the record though, there was a noticeable increase in the company's current liabilities over the period, so we would attribute some of the ROCE growth to that. Essentially the business now has suppliers or short-term creditors funding about 23% of its operations, which isn't ideal. It's worth keeping an eye on this because as the percentage of current liabilities to total assets increases, some aspects of risk also increase.
The Bottom Line On Energy Resources of Australia's ROCE
In summary, it's great to see that Energy Resources of Australia has been able to turn things around and earn higher returns on lower amounts of capital. Given the stock has declined 12% in the last five years, this could be a good investment if the valuation and other metrics are also appealing. With that in mind, we believe the promising trends warrant this stock for further investigation.
One more thing to note, we've identified 1 warning sign with Energy Resources of Australia and understanding it should be part of your investment process.
If you want to search for solid companies with great earnings, check out this free list of companies with good balance sheets and impressive returns on equity.
This article by Simply Wall St is general in nature. It does not constitute a recommendation to buy or sell any stock, and does not take account of your objectives, or your financial situation. We aim to bring you long-term focused analysis driven by fundamental data. Note that our analysis may not factor in the latest price-sensitive company announcements or qualitative material. Simply Wall St has no position in any stocks mentioned.
Have feedback on this article? Concerned about the content? Get in touch with us directly. Alternatively, email editorial-team (at) simplywallst.com.
Individual and institutional investors as well as advisors are invited to log-on to VirtualInvestorConferences.com to view presentations
NEW YORK, April 2, 2021 /CNW/ – Virtual Investor Conferences, the leading proprietary investor conference series today announced that the presentations from the March Extractive Industry lnvestor Conference are now available for on-demand viewing.
REGISTER OR LOGIN NOW TO VIEW THE PRESENTATIONS: https://bit.ly/2PllJGf
The company presentations will be available 24/7 for 90 days. Investors, advisors and analysts may download shareholder materials from the "virtual trade booth" for the next three weeks.
Participating Companies:
|
Presentation |
Ticker(s) |
|
Keynote Presentation: By-Passing China in the Economic Recovery Christopher Ecclestone, Mining Strategist Hallgarten & Co. |
|
|
Appia Energy Corp. |
(OTCQB: APAAF | CSE: API) |
|
Osisko Metals Inc. |
(OTCQX: OMZNF | TSX-V: OM) |
|
Nova Royalty Corp. |
(OTCQB: NOVRF | TSX-V: NOVR) |
|
Northern Minerals Ltd. |
(Pink: NMEX | ASX: NTU) |
|
Luncheon Speaker: Can Critical Metal Supply Chains be Economically Constructed in the Free World? Jack Lifton, Founder, Technology Metals Research |
|
|
Energy Fuels Inc. |
(NYSE American: UUUU | TSX: EFR) |
|
Vision Lithium Inc. |
(OTCQB: ABEPF | TSX-V: VLI) |
|
Electric Royalties, Ltd. |
(Pink: ELECF | TSX-V: ELEC) |
|
Intercontinental Gold and Metals Ltd. |
|
|
Canada Silver Cobalt Works Inc. |
(OTCQB: CCWOF | TSX-V: CCW) |
|
Renforth Resources Inc. – Nickel/Surimeau |
(OTCQB: RFHRF | CSE: RFR) |
|
Thor Mining PLC |
(OTCQB: THORF | ASX: THR | AIM: THR) |
|
Vital Metals Ltd. |
(Pink: VTMXF | ASX: VML) |
|
Lake Resources NL |
(OTCQB: LLKKF | ASX: LKE) |
|
Keynote Presentation: The Outlook for Precious Metals Prices Jeffrey M. Christian, Managing Partner CPM Group |
|
|
Amex Exploration Inc. |
(OTCQX: AMXEF |TSX-V: AMX) |
|
Bonterra Resources Inc. |
(OTCQX: BONXF | TSX-V: BTR) |
|
Vanstar Mining Resources, Inc. |
(Pink: VMNGF | TSX-V: VSR) |
|
Signature Resources Ltd. |
(OTCQB: SGGTF | TSX-V: SGU) |
|
Luncheon Speaker: Silver: The Technometal New Demand, New Policy, New Future Phillips S. Baker, Jr., President & CEO of Hecla Mining |
|
|
VanGold Mining Corp. |
(OTC VGLDF |TSX-V: VGLD) |
|
Golden Valley Mines Ltd. |
(OTCQX: GLVMF | TSX-V: GZZ) |
|
Renforth Resources Inc. – Gold/Parbec |
(OTCQB: RFHRF | CSE: RFR) |
|
Trillium Gold Mines Inc. |
(OTCQX: TGLDF | TSX-V: TGM) |
|
Aztec Minerals Corp. |
(OTCQB: AZZTF | TSX-V: AZT) |
|
Prosper Gold Corp. |
(OTCQX: PGXFF | TSX-V: PGX) |
|
Silver Bullet Mines, Inc. |
|
|
Honey Badger Silver Inc. |
(Pink: HBEIF | TSX-V: TUF) |
|
Fabled Silver Gold Corp |
(OTCQX: FBSGF | TSX-V: FCO) |
To facilitate investor relations scheduling, for more information about the program and to view a complete calendar of Virtual Investor Conferences, please visit www.virtualinvestorconferences.com.
About Virtual Investor Conferences®Virtual Investor Conferences (VIC) is the leading proprietary investor conference series that provides an interactive forum for publicly-traded companies to meet and present directly with investors.
A real-time solution for investor engagement, Virtual Investor Conferences is part of OTC Market Group's suite of investor relations services specifically designed for more efficient Investor Access. Replicating the look and feel of on-site investor conferences, Virtual Investor Conferences combine leading-edge conferencing and investor communications capabilities with a comprehensive global investor audience network.
SOURCE VirtualInvestorConferences.com
Cision
View original content: http://www.newswire.ca/en/releases/archive/April2021/02/c3140.html
With its stock down 10% over the past three months, it is easy to disregard EROAD (NZSE:ERD). However, stock prices are usually driven by a company’s financials over the long term, which in this case look pretty respectable. In this article, we decided to focus on EROAD's ROE.
Return on Equity or ROE is a test of how effectively a company is growing its value and managing investors’ money. Put another way, it reveals the company's success at turning shareholder investments into profits.
View our latest analysis for EROAD
How Is ROE Calculated?
ROE can be calculated by using the formula:
Return on Equity = Net Profit (from continuing operations) ÷ Shareholders' Equity
So, based on the above formula, the ROE for EROAD is:
2.3% = NZ$2.1m ÷ NZ$92m (Based on the trailing twelve months to September 2020).
The 'return' is the yearly profit. Another way to think of that is that for every NZ$1 worth of equity, the company was able to earn NZ$0.02 in profit.
What Has ROE Got To Do With Earnings Growth?
So far, we've learned that ROE is a measure of a company's profitability. Based on how much of its profits the company chooses to reinvest or "retain", we are then able to evaluate a company's future ability to generate profits. Generally speaking, other things being equal, firms with a high return on equity and profit retention, have a higher growth rate than firms that don’t share these attributes.
A Side By Side comparison of EROAD's Earnings Growth And 2.3% ROE
As you can see, EROAD's ROE looks pretty weak. Even compared to the average industry ROE of 32%, the company's ROE is quite dismal. However, the moderate 13% net income growth seen by EROAD over the past five years is definitely a positive. We reckon that there could be other factors at play here. For example, it is possible that the company's management has made some good strategic decisions, or that the company has a low payout ratio.
As a next step, we compared EROAD's net income growth with the industry, and pleasingly, we found that the growth seen by the company is higher than the average industry growth of 10%.

Earnings growth is a huge factor in stock valuation. It’s important for an investor to know whether the market has priced in the company's expected earnings growth (or decline). Doing so will help them establish if the stock's future looks promising or ominous. Has the market priced in the future outlook for ERD? You can find out in our latest intrinsic value infographic research report.
Is EROAD Making Efficient Use Of Its Profits?
Summary
Overall, we feel that EROAD certainly does have some positive factors to consider. Despite its low rate of return, the fact that the company reinvests a very high portion of its profits into its business, no doubt contributed to its high earnings growth. That being so, the latest analyst forecasts show that the company will continue to see an expansion in its earnings. Are these analysts expectations based on the broad expectations for the industry, or on the company's fundamentals? Click here to be taken to our analyst's forecasts page for the company.
This article by Simply Wall St is general in nature. It does not constitute a recommendation to buy or sell any stock, and does not take account of your objectives, or your financial situation. We aim to bring you long-term focused analysis driven by fundamental data. Note that our analysis may not factor in the latest price-sensitive company announcements or qualitative material. Simply Wall St has no position in any stocks mentioned.
Have feedback on this article? Concerned about the content? Get in touch with us directly. Alternatively, email editorial-team (at) simplywallst.com.
CALGARY, AB, April 2, 2021 /CNW/ – Uravan Minerals Inc. (TSXV: UVN) ("Uravan") announces the sale of its Outer Ring mining claims (the "OR Claims") located in the Athabasca Basin, in Saskatchewan. The OR Claims were purchased from Uravan by an independent exploration group.
From 2011 to 2016 Uravan's technical team evaluated the OR Claims by applying surface geochemical techniques and airborne geophysical surveys, followed by several drill programs that targeted potential areas identified. The results of this work provided no positive uranium mineral response; hence, the Uravan Board did not recommend incurring further exploration expenditures on the OR Claims.
Therefore, due to Uravan's current financial constraints, weak spot natural uranium prices and lack of access to financial markets or other sources of financing, Uravan determined it is in the best interest of its shareholders to divest and sell the OR Claims in lieu of allowing the claims to lapse due to a lack of further work expenditures.
Uravan will continue to pursue and evaluate other businesses and strategic opportunities, both within and outside the mineral exploration industry, to include mergers and RTO arrangements and will make further announcements with respect to these efforts in due course.
Cautionary Statement
This press release may contain forward looking statements including those describing Uravan's plans and the expectations of management that a stated result or condition will occur. Any statement addressing future events or conditions necessarily involves inherent risk and uncertainty. Actual results can differ materially from those anticipated by management at the time of writing due to many factors, much of which are beyond the control of Uravan and its management. This news release contains forward-looking statements pertaining. Readers are cautioned that the foregoing list of risk factors should not be construed as exhaustive.These statements speak only as of the date of this release or as of the date specified in the documents accompanying this release.The Corporation undertakes no obligation to publicly update or revise any forward-looking statements except as expressly required by applicable securities laws.
Neither TSX Venture Exchange nor its Regulation Services Provider (as that term is defined in policies of the TSX Venture Exchange) accepts responsibility for the adequacy or accuracy of this release.
SOURCE Uravan Minerals Inc.

View original content: http://www.newswire.ca/en/releases/archive/April2021/02/c6961.html
TORONTO, ON / ACCESSWIRE / April 1, 2021 / PJX Resources Inc. (TSXV:PJX) ("PJX") is pleased to announce that drilling by DLP Resources ("DLP") on PJX's DD Property has intersected strongly hydrothermally altered and sheared Sullivan horizon siltstone/argillite at Sullivan Horizon target depth from 1452.46m to 1550m in hole DDH21-01 (Figure 1). Weak pyrrhotite (iron-sulphide), chalcopyrite (copper-iron-sulphide) and trace pyrite (iron-sulphide) occur through the alteration zone. The hole ended at 1728m in weakly altered lower Aldridge sediments with tourmalinite.
John Keating, President of PJX commented: "Only two holes spaced 2 km apart have been drilled on the DD Property. Both holes intersected hydrothermally altered sediments at target depth called the Sullivan time horizon, the geological age when the Sullivan deposit was formed. These holes and historical holes drilled about 4 km and 5.5 km to the east, on the Moby Dick and NZOU Properties, support the potential for Sullivan type massive sulphide mineralization. We are pleased that DLP is encouraged by results to date and will continue drilling to test large Magnetotelluric (MT) anomalies at target depth along a 5 km untested trend."
Next Steps
According to DLP, strong sericite-silica alteration and yellow-brown phengite visible in the altered Sullivan horizon confirms hole DD21-01 is distal from a mineralized source. Drilling will now move 2.1km to the SE where the main NE-SW trend of MT anomalies corresponds with DLP's vectoring to the main Sullivan Zn-Pb-Ag targets over approximately 5.1km. Drilling of the first of four targets along this trend is planned to commence in the first week of April (Figures 2 and 3).
PJX's DD Property, located near Cranbrook, British Columbia, is under option to DLP Resources. (see Property Ownership below).
The geological disclosure and content of this news release has been reviewed and approved by Dave Pighin, P.Geo., and John Keating P.Geo. (qualified persons for the purpose of National Instrument 43-101 Standards of Disclosure for Mineral Projects). Mr. Pighin is the consulting geologist for PJX and DLP on the DD Property. Mr. Keating is the President, Chief Executive Officer and a Director of PJX.

Figure 1:Titan MT resistivity section along Line 5N showing Drill Hole DD21-01

Figure 2:Titan MT resistivity plan at 0m elevation with DD21-01 on the Gerry Vent and Planned DD21-02 on the main MT Anomaly trend

Figure 3:Simplified plan showingMT anomalies at 0m elevation on the DD-Moby Dick and NZOU Properties and DD21-01 and DD21-02 Drill Holes
DD, NZOU and Moby Dick Property Ownership
DLP can earn a 50% interest in the DD Property by spending $4 million in exploration expenditures on the DD, Moby Dick and NZOU Properties and paying $250,000 cash to PJX by July 13, 2024.
DLP can earn an additional 25% interest, to a total of 75% interest, in the DD Property by completing a Commercial Feasibility Study on the 3 properties by July 13, 2028.
PJX (50%) and DLP (50%) jointly own 100% of the mineral rights to the Moby Dick Property and jointly have the right to own 100% interest in the NZOU Property through an option agreement between DLP and the NZOU Property owner. Exploration expenditures incurred by DLP on these two properties will be applied toward DLP's exploration expenditure requirements to earn an interest in the DD Property.
About PJX Resources Inc.
PJX is a mineral exploration company focused on building shareholder value and community opportunity through the exploration and development of mineral resources with a focus on gold and base metals. PJX's gold properties (Gold Shear, Eddy, Zinger, Dewdney Trail) and base metal properties (Vine, DD, West Basin, Parker Copper) are located in the historical Sullivan mining district and Vulcan Gold Belt of Cranbrook and Kimberley, British Columbia. Please refer to our web site http://www.pjxresources.com for additional information.
FOR FURTHER INFORMATION PLEASE CONTACT:
Linda Brennan, Chief Financial Officer
(416) 799-9205
info@pjxresources.com
Neither the TSX Venture Exchange nor its Regulation Services Provider (as that term is defined in the policies of the TSX Venture Exchange) accepts responsibility for the adequacy or accuracy of this release.
Forward-Looking Information
This News Release contains forward-looking statements. Forward looking statements are statements which relate to future events. Forward-looking statements include, but are not limited to, statements with respect to exploration results, the success of exploration activities, mine development prospects, completion of economic assessments, and future gold production. In some cases, you can identify forward-looking statements by terminology such as "may", "appears to", "should", "expects", "plans", "anticipates", believes", "estimates", "predicts", "potential", or "continue" or the negative of these terms or other comparable terminology. These statements are only predictions and involve known and unknown risks, uncertainties and other factors that may cause our actual results, level of activity, performance, or achievements to be materially different from any future results, levels of activity, performance, or achievements expressed or implied by these forward-looking-statements.
Although PJX has attempted to identify important factors that could cause actual actions, events or results to differ materially from those described in forward-looking statements, there may be other factors that cause actions, events or results not to be as anticipated, estimated or intended. There can be no assurance that forward-looking statements will prove to be accurate, as actual results and future events could differ materially from those anticipated in such statements. Accordingly, readers should not place undue reliance on forward-looking statements.
SOURCE: PJX Resources Inc.
View source version on accesswire.com:
https://www.accesswire.com/638521/DLP-Resources-Continues-Drilling-on-PJX-Resources-DD-Property
Vancouver, British Columbia–(Newsfile Corp. – April 1, 2021) – Orestone Mining Corp. (TSXV: ORS) ("Orestone" or the "Company") has, subject to regulatory approval, granted to officers, directors, advisors and consultants of the Company incentive stock options to purchase an aggregate of 1,615,000 common shares. The options are exercisable until April 1, 2026 at an exercise price of $0.12 per share.
Orestone Mining Corp. is a Canadian based company that owns a 100% percent interest in the 37 square kilometre Captain gold-copper porphyry project in north central British Columbia. The project hosts a gold-copper porphyry system which encompasses a cluster of large targets (see website for maps) located 41 kilometres north of Fort St. James, B.C. and 30 kilometres south of the Mt. Milligan copper-gold mine. The Captain Project features relatively flat terrain, moderate tree cover and an extensive network of logging and Forest Service roads suitable for exploration year around.
For more information please visit: www.orestone.ca
ON BEHALF OF ORESTONE MINING CORP.
"David Hottman"
CEO
For further information please contact:
Tel: 604-629-1929
Fax: 604-629-1930
Email: info@orestone.ca
Website: www.orestone.ca
Neither the TSX Venture Exchange nor its Regulation Services Provider (as that term is defined in the policies of the TSX Venture Exchange) accepts responsibility for the adequacy or accuracy of this News Release. This news release has been prepared by management and no regulatory authority has approved or disapproved the information contained herein.

To view the source version of this press release, please visit https://www.newsfilecorp.com/release/79246
NOT FOR DISSEMINATION IN THE UNITED STATES OF AMERICA OR TO US WIRE SERVICES
-
Rogue has received a formal refusal from Québec's Ministère des Forêts, de la Faune et des Parcs ("MFFP") regarding the permit application for the Company's Silicon Ridge Project
-
After 6 years of investment, based on the continued perceived support and explicit signoffs along the way, the Company will now pivot to seek fair compensation of its investment, the project value, and other damages
TORONTO, ON / ACCESSWIRE / April 1, 2021 / Rogue Resources Inc. (TSXV:RRS) ("Rogue" or the "Company") is deeply disappointed to announce that the Province of Québec has chosen to refuse the permit process attempting to advance its 100% owned Silicon Ridge Project ("Project"), located approximately 42 kilometres ("km") north of Baie-Saint-Paul, Québec, and 4 km northeast of Sitec's operating silica mine.
The Silicon Ridge Project represented an opportunity for the development of a quarrying operation with limited environmental impacts, operating within an area that currently supports active quarrying operations co-existing with the local wildlife. The Company designed its project to minimize the impacts on the wildlife and other stakeholders within the region. The local community was supportive of the Project for jobs (see News Release dated March 27, 2017) and Québec-based buyers of the quartz were interested in the new supply, to help supply silicon metal production and Québec's focus on the new green economy.
"It's very disappointing to be told that our Project is now officially blocked, but frankly, given the long delays in the process and lack of any open solution-oriented dialogue with MFFP representatives since mid-2017, it is not a total surprise", said Sean Samson, President and CEO of Rogue. "Rogue has remained consistent and transparent with the government throughout this process but we did not feel it was reciprocal. Rogue had listened to MFFP's initial, informal review of the Project and chose to significantly reduce its geographic footprint. I am convinced our projected disturbance was minimal and negligible compared to the average forestry operation in the area. I am saddened for our local team on the ground in the Charlevoix community, who wanted the long-term good paying jobs, and also for the Huron-Wendat Nation with whom we have a partnership agreement. We will work through the options from here with our advisors. While we see this as a setback to our objective of bringing Québec's Silicon Ridge Project into production, Rogue has continued to advance our other projects, including the successful Rogue Stone – Limestone quarries in Ontario."
Brief Overview of Interaction with the Province of Québec
Rogue acquired the Silicon Ridge Project in August 2014 and immediately began additional investments in developing the Project by spending on Exploration and Technical Analysis, using Québec-based firms. Soon after Rogue initiated the programs, in 2015 the province (through SIDEX- an initiative of the Québec government and the Fonds de solidarité des travailleurs du Québec) invested directly into Rogue, to support the Company's work in the province.
Initially, the Province of Québec (and the MFFP) were very supportive
In January 2015 the MFFP approved the extensive deforestation permit related to the initial drill plan. Combined with the permit from the Ministère de l'Énergie et des Ressources naturelles ("MERN"), Rogue spent $3.5M on the Project's Exploration and Technical Analysis by April 30, 2016 (Rogue's fiscal year-end), using almost all Québec-based suppliers.
Based on research conducted by Rogue's team using publicly available information on the Woodland Caribou, initial feedback from the MFFP and discussions with stakeholders in the community, Rogue voluntarily decided to improve the Project's original concept to minimize impact on the Woodland Caribou habitat and potential sightlines from the regional tourist areas. These improvements were across 4 main areas (this became the "2017 Project Plan"):
-
Footprint: The project area was reduced by over 50% between the 2016 and the 2017 Project Plans.
-
Site Layout: Improved the design of waste piles to be behind ridges and barely visible from the Mont du Lac-des-Cygnes viewpoint in the Parc national des Grands-Jardins. Rogue proposed to upgrade existing trails/roads accessing the property as much as possible.
-
Continuous Reclamation: Rogue proposed to shift to refilling the mining void on a regular basis with overburden and waste material to minimize the overall open cut.
-
Operating Schedule: Rogue proposed to shift from year-round operation in the 2016 Project Plan to a limited "spring through fall" operation in the 2017 Project Plan. Rogue also anticipated additional restrictions during the important spring calving season.
The 2017 Project Plan was done voluntarily and was well received by representatives of the MFFP at meetings in February 2017.
Rogue applied for permits, everything hinged on MFFP
After the February MFFP meetings, Rogue submitted the Section 128.7 Authorization application and expected an expedited turnaround as had been discussed with MFFP representatives. Rogue publicly planned to target commercial operation in 2017 at Silicon Ridge (see News Release dated February 13, 2017).
It should be noted that the Company had also submitted the applications for:
-
The bail d'exploitation minière permit ("BEX"). Based upon communications with the representatives of the MERN, Rogue was told that it had provided all of the required information for the Ministry to complete the application process except for the requirement that the MFFP provide its decision on the Section 128.7 Authorization;
-
The Certificate of Authorization ("CofA") with Ministère de Développement durable, de l'Environnement et de la Lutte contre les changements climatiques ("MDDELCC") and based on communications with representatives of the MDDELCC, Rogue had provided all of the required information for the Ministry to complete the application process except for the MFFP's Section 128.7 Authorization and the BEX from the MERN.
In summary, by April 2017 everything was complete for the Project to advance, pending the MFFP's Section 128.7 Authorization decision.
In the 12 months from April 30, 2016, during this period of continued positive feedback from the MFFP, Rogue spent an additional $900K on Environmental Studies, Exploration and Consultants, using almost all Québec-based suppliers.
MFFP permitted additional spending in Spring 2017
On April 27, 2017 the MFFP approved an additional exploration program including the stripping of overburden from approximately 4,500 square metres, covering a portion of the quartzite on top of the ridge to expose the bedrock for detailed mapping, sampling and to confirm the depth of the overburden in the area (see News Release dated April 27, 2017). Despite approving the Exploration permit (and Rogue proceeding to spend more on the Project), no update was available on the Section 128.7 Authorization application.
After the MFFP approved this work, Rogue spent $460K on this Exploration program, using only local suppliers.
After the Spring 2017 spending, everything changed
The Company made numerous requests to the MFFP regarding its permit application, including email and meeting requests, for an estimate of when the decision on the Section 128.7 Authorization application would be reached and asked if any additional information was required to finalize a decision. Until a meeting in August, 2017 there were no substantive communications from the MFFP and the Company continued to be impacted by the lack of clarity on the timing for potential sales contract negotiations and a development decision for the project.
At the August 2017 meeting, the project was put on hold (see News Release dated August 10, 2017), the MFFP explained that a decision on the Section 128.7 Authorization application would not be made until a policy study forming part of the Province-wide action plan for the development of forest-dwelling caribou habitat was completed in Spring of 2018.
Deadlines passed and Promises were ignored
In March 2018, the MFFP informed Rogue that the MFFP's decision would be further delayed, until fall of 2018. No update was provided for the remainder of 2018 and most of 2019, despite continued attempts to seek information.
In November 2019, the MFFP agreed to a telephone update and explained that the Study was taking longer than expected and there was now no date for completion. The MFFP promised to keep Rogue updated if anything changed.
In March 2020, the Province of Québec's Budget referenced the Woodland Caribou, including funding to "…support companies that could be impacted by measures in the government's future strategy". This was the first official mention of potential compensation of companies for impacts from the political inaction. When Rogue was able to ask MFFP about this it was explained as something "directed at the forestry companies".
In April 2020, the MFFP made a statement that Québec would not act until 2022.
In early May 2020, Rogue met with the federal Minister of Environment and Climate Change and explained that the Company was still waiting to hear back from the MFFP.
Later in May 2020, Rogue's management and representatives of the Board and external counsel participated in an update call with the MFFP. On the call the MFFP explained that Rogue would soon receive a decision, promising this by the end of June (one month away). Nothing was heard in response.
In June 2020, Rogue was invited to meet at La Malbaie with Minister Pierre Dufour of the MFFP and also the minister responsible for the region of Abitibi-Témiscamingue and the region of Nord-du-Québec. This was a group session, with regional members of industry invited. No new details were presented or discussed.
In September 2020 Rogue was invited to participate in another industry meeting, this time in Québec City. The Company was not able to attend this meeting in-person but again asked about the update promised on the May call and heard nothing in response.
In early October 2020 the MFFP accepted Rogue's continued requests for an update and held a videoconference with Rogue's management and representatives of the Board. During this call, the MFFP referred multiple times to the existence of zones which are "Hot Spots" (a non-technical, MFFP term) for the Woodland Caribou and that one Hot Spot is on Rogue's Project site. Rogue specifically asked how long had the MFFP known about this Hot Spot and was told that it was well documented internally and had been known for some years by the ministry. This was entirely new information for Rogue and was data that the Company had been asking for since the initial meetings with the MFFP in 2016. The MFFP promised to send full details in a letter.
Later in October 2020, Rogue received a letter from the MFFP which did not detail the information referred to on the videoconference, it did not include further information about Woodland Caribou Hot Spot on Rogue's specific Project site, but rather discussed broad generalities about habitat and seasons, which Rogue feels it had addressed with measures it had already taken to limit the habitat and operational impact of the Silicon Ridge Project.
This week's letter also included broad generalities, with none of the detail that Rogue has been continuously requesting.
Rogue was told that its permit application has been refused because of the feared impact of the project's specific land on the province's Woodland Caribou. Despite repeated promises to provide animal traffic data specific to Silicon Ridge, none has ever been provided. In December, media reports claimed that the Charlevoix Woodland Caribou herd was now down to 19 animals across the entire 4,000 square kilometer region1. The MFFP has GPS collars on most if not all of these animals and although repeatedly promising, never provides the area-specific information.
As also has been explained in detail, the Company's voluntary decision to shift to the 2017 Project Plan significantly limited its impact to 0.5 square kilometres. Rogue felt that it had addressed MFFP's original concerns with measures by limiting the habitat and operational impact of the Silicon Ridge Project and has respectfully requested for similar treatment as the neighboring quarry, owned by Sitec Amérique du Nord Inc. ("Sitec", now owned by Cambria, a US company based in Le Sueur, Minnesota), which has operated its quartz quarry for more than 50 years. Rogue's Silicon Ridge quarry clearly falls within the existing zone of impact as the Sitec quarry.
Over the past six years Rogue has been consistently transparent with various ministries of the Government of Québec, including the MFFP, and in return, the various ministries, including the MFFP, have provided irregular and inconsistent communications to Rogue and now has delivered a formal refusal of the Company's application.
Given the encouragement to continue investing and creating good paying jobs in Québec, the Government of Québec, including the MFFP, have provided continued approvals and encouragement, which led Rogue to continue investing and developing its project. Rogue has remained consistent and has reacted positively to continued support and signoffs along the way. Similarly, Rogue has been consistent in stressing that if a permit is not to be issued, it would expect fair compensation. Rogue has invested more than $5M so far into the Silicon Ridge Project and the Project has been valued at almost 5x that amount by an independent study performed by Québec based engineers and geologists (see News Release dated May 23, 2017). All of this spending has been audited, can be demonstrated and explained, and, most importantly was spent based on stage-gated approvals by the MFFP as the Company progressed.
Rogue has notified the Province of Québec that it plans to explore all legal options open to it, to protect the Company and secure fair compensation.
About Rogue Resources Inc.
Rogue is a mining company focused on generating positive cash flow. Not tied to any commodity, it looks at rock value and quality deposits that can withstand all stages of the commodity price cycle. The Company includes Rogue Stone selling quarried limestone for landscape applications from two operating quarries in Ontario; Rogue Quartz focused on advancing its silica/quartz business with the Snow White Project in Ontario and the Silicon Ridge Project in Québec; Rogue Timmins with the gold potential at Radio Hill and an ownership position in the private company EV Nickel, exploring in the Shaw Dome.
Qualified Person
The Company's Projects are under the direct technical supervision of Paul Davis, P.Geo., and Vice-President of the Company. Mr. Davis is a Qualified Person as defined by NI 43-101. He has reviewed and approved the technical information in this press release. There are no known factors that could materially affect the reliability of the information verified by Mr. Davis.
For more information visit www.rogueresources.ca or contact:
+1-647-243-6581
info@rogueresources.ca
Cautionary Note Regarding Forward-Looking Statements:
This news release contains certain statements or disclosures relating to the Company that are based on the expectations of its management as well as assumptions made by and information currently available to the Company which may constitute forward-looking statements or information ("forward-looking statements") under applicable securities laws. Forward-looking statements are statements that are not historical facts and are generally, but not always, identified by the words "believes", "anticipates", "expects", "plans", "intends", "target", "estimates", "projects", "continue", "potential" and similar expressions, or are events or conditions that "will", "would", "may", "could" or "should" occur or be achieved. In particular, but without limiting the foregoing, this news release contains forward-looking statements pertaining to the following: closing of future tranches of the Private Placement.
The forward-looking statements contained in this news release reflect several material factors and expectations and assumptions of the Company including, without limitation: business strategies and the environment in which the Company will operate in the future; commodity prices; exploration and development costs; mining operations, drilling plans and access to available goods and services and development parameters; regulatory restrictions; the ability of the Company to obtain applicable permits; the ability of the Company to service its debt obligations; the Company's ability to qualify for government funded support programs; the Company's ability to raise capital on terms acceptable to it or at all; activities of governmental authorities (including changes in taxation and regulation); currency fluctuations; the unpredictable economic impact of the COVID-19 pandemic, including the acquisition of equipment and recruitment of human resources required for the sales expansion; the global economic climate; and competition.
The Company believes that the material factors, expectations and assumptions reflected in the forward-looking statements contained in this news release are reasonable at this time but no assurance can be given that these factors, expectations and assumptions will prove to be correct. The forward-looking statements included in this news release are not guarantees of future performance and should not be unduly relied upon. Such forward-looking statements involve known and unknown risks, uncertainties and other factors that may cause actual results or events to differ materially from those anticipated in such forward-looking statements including, without limitation, those risks identified in the Company's most recent annual and interim management's discussion and analysis, copies of which are available on the Company's SEDAR profile at www.sedar.com. Readers are cautioned that the foregoing list of factors is not exhaustive and are cautioned not to place undue reliance on these forward-looking statements.
The forward-looking statements contained in this news release are made as of the date hereof and the Company undertakes no obligations to update publicly or revise any forward-looking statements, whether as a result of new information, future events or otherwise, unless so required by applicable securities laws. This news release does not constitute an offer to sell or a solicitation of an offer to buy any securities in the United States of America. The securities have not been and will not be registered under the United States Securities Act of 1933 (the "U.S. Securities Act") or any state securities laws and may not be offered or sold within the United States or to U.S. Persons (as defined in the U.S. Securities Act) unless registered under the U.S. Securities Act and applicable state securities laws, or an exemption from such registration is available.
Neither the TSXV nor its Regulation Services Provider (as that term is defined in the policies of the TSXV) accepts responsibility for the adequacy or accuracy of this news release.
1 Reported via https://ici.radio-canada.ca/nouvelle/1755320/caribous-charlevoix-declin-seuil-critique-enclos-faune
SOURCE: Rogue Resources Inc.
View source version on accesswire.com:
https://www.accesswire.com/638671/Rogue-Update-Quebec-Refuses-Silicon-Ridge-Application
Finding a business that has the potential to grow substantially is not easy, but it is possible if we look at a few key financial metrics. Amongst other things, we'll want to see two things; firstly, a growing return on capital employed (ROCE) and secondly, an expansion in the company's amount of capital employed. Put simply, these types of businesses are compounding machines, meaning they are continually reinvesting their earnings at ever-higher rates of return. So on that note, Fresnillo (LON:FRES) looks quite promising in regards to its trends of return on capital.
Understanding Return On Capital Employed (ROCE)
Just to clarify if you're unsure, ROCE is a metric for evaluating how much pre-tax income (in percentage terms) a company earns on the capital invested in its business. The formula for this calculation on Fresnillo is:
Return on Capital Employed = Earnings Before Interest and Tax (EBIT) ÷ (Total Assets – Current Liabilities)
0.13 = US$714m ÷ (US$5.7b – US$340m) (Based on the trailing twelve months to December 2020).
Therefore, Fresnillo has an ROCE of 13%. In absolute terms, that's a pretty normal return, and it's somewhat close to the Metals and Mining industry average of 14%.
Check out our latest analysis for Fresnillo

Above you can see how the current ROCE for Fresnillo compares to its prior returns on capital, but there's only so much you can tell from the past. If you're interested, you can view the analysts predictions in our free report on analyst forecasts for the company.
What Does the ROCE Trend For Fresnillo Tell Us?
Fresnillo is displaying some positive trends. The data shows that returns on capital have increased substantially over the last five years to 13%. The company is effectively making more money per dollar of capital used, and it's worth noting that the amount of capital has increased too, by 42%. The increasing returns on a growing amount of capital is common amongst multi-baggers and that's why we're impressed.
What We Can Learn From Fresnillo's ROCE
All in all, it's terrific to see that Fresnillo is reaping the rewards from prior investments and is growing its capital base. Considering the stock has delivered 1.3% to its stockholders over the last five years, it may be fair to think that investors aren't fully aware of the promising trends yet. So with that in mind, we think the stock deserves further research.
If you want to continue researching Fresnillo, you might be interested to know about the 2 warning signs that our analysis has discovered.
While Fresnillo may not currently earn the highest returns, we've compiled a list of companies that currently earn more than 25% return on equity. Check out this free list here.
This article by Simply Wall St is general in nature. It does not constitute a recommendation to buy or sell any stock, and does not take account of your objectives, or your financial situation. We aim to bring you long-term focused analysis driven by fundamental data. Note that our analysis may not factor in the latest price-sensitive company announcements or qualitative material. Simply Wall St has no position in any stocks mentioned.
Have feedback on this article? Concerned about the content? Get in touch with us directly. Alternatively, email editorial-team (at) simplywallst.com.
If you would like to receive our free newsletter via email, simply enter your email address below & click subscribe.
 Follow us on Twitter
 Become our facebook fan
CONNECT WITH US
Tweets
Tweet with hash tag #miningfeeds or @miningfeeds and your tweets will be displayed across this site.
MOST ACTIVE MINING STOCKS
Daily Gainers
 CMC Metals Ltd. CMC Metals Ltd. |
CMB.V | +900.00% |
| Alturas Minerals Corp |
ALT.V | +100.00% |
 Northern Manganese Limited Northern Manganese Limited |
NTM.AX | +100.00% |
| Silver Spruce Resources Inc. |
SSE.V | +100.00% |
| Finlay Minerals Ltd. |
FYL.V | +53.33% |
| Kestrel Gold Inc. |
KGC.V | +40.00% |
| GTI Resources Ltd. |
GTR.AX | +33.33% |
| Green Light Resources Inc. |
GR.V | +33.33% |
| Iberian Minerals Corp. |
IZN.V | +33.33% |
| Greenlight Resources Inc |
GR.V | +33.33% |


