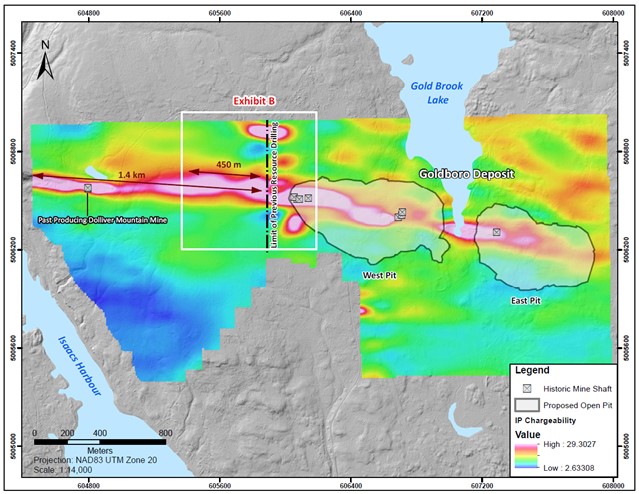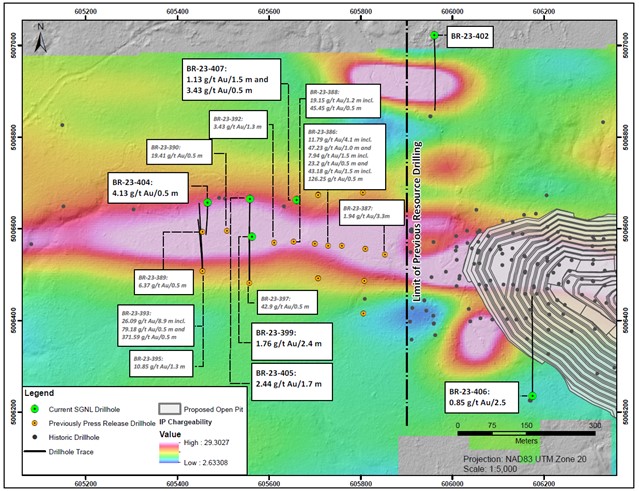
Signal Gold (TSX:SGNL) has released results from its diamond drilling program at the Goldboro Project in Nova Scotia. The project underwent a step-out drilling program involving 31 holes covering 6,026.5 metres. This program aimed to explore gold mineralization west of the Goldboro Deposit. Remarkably, gold mineralization has been discovered up to 450 metres west of the area previously drilled for resource definition. The findings are a part of a broader exploration project that has examined a 1.4-kilometre stretch of the Goldboro Trend west of the established Goldboro Mineral Resource.
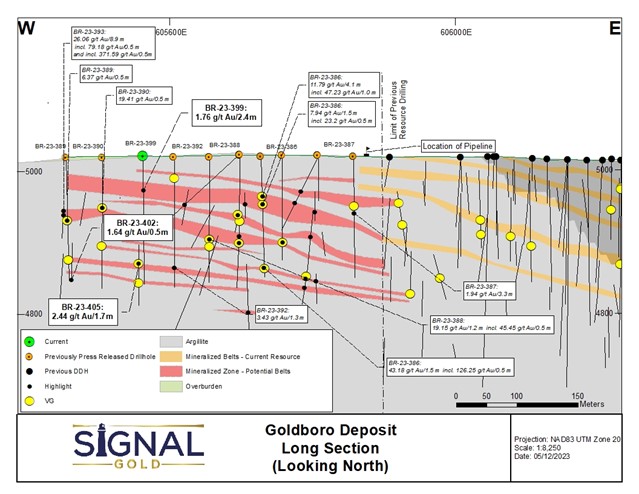
The latest drilling results include 1,446.5 metres from seven diamond drill holes, labelled BR-23-399, 402, and 404 to 407. This drilling yielded 27 intersections of gold mineralization, including three instances where gold was visibly evident. Notable findings from these drill holes are as follows:
– 109.91 grams per tonne (g/t) of gold over 0.5 metres at a depth between 92.8 and 93.3 metres in hole BR-23-399.
– 2.44 g/t of gold over 1.7 metres at a depth between 167.6 and 169.3 metres in hole BR-23-405.
– 1.76 g/t of gold over 2.4 metres at the same depths in hole BR-23-399.
Earlier drilling in this area had uncovered high-grade gold mineralization. Some of the notable past results include:
– 26.09 g/t of gold over 8.9 metres at depths between 105.5 and 114.4 metres in hole BR-23-393, which includes segments of 79.18 g/t and 371.59 g/t gold over 0.5 metres each.
– 11.79 g/t of gold over 4.1 metres at depths between 49.9 and 54.0 metres in hole BR-23-386, including a segment with 47.23 g/t gold over 1.0 metre.
– Several other high-grade intersections in various drill holes.
The exploration in the area extending up to 450 metres west of the Goldboro Deposit continues to uncover gold mineralization. These findings suggest that the mineralization extends further west towards the previously operational Dolliver Mountain Gold Mine and remains open at depth.
During the drilling program, holes BR-23-402 and 406 were specifically designed to target IP (Induced Polarization) chargeability anomalies. These anomalies were located parallel to but on either side of the main host structure and chargeability trend. However, drill hole BR-23-402, positioned north of the Goldboro Trend, did not intersect significant gold mineralization. Similarly, drill hole BR-23-407, located south of the trend, did not find significant gold mineralization in the associated chargeability response area but did intersect gold deeper within the hinge of the anticline in the West Goldbrook System.
The company is awaiting assay results for an additional 32 drill holes, which encompass 6,195 metres of drilling from the overall program.


Highlights from the results are as follows:
A table of selected composited assay results from the drill program
| Drill hole | From (m) | To (m) | Interval (m) | Gold (g/t) | Visible Gold |
| BR-23-399 | 17.6 | 18.1 | 0.5 | 1.84 | |
| and | 33.2 | 33.7 | 0.5 | 1.95 | |
| and | 39.7 | 43.0 | 3.3 | 0.66 | |
| and | 44.2 | 46.6 | 2.4 | 1.76 | |
| and | 51.1 | 51.6 | 0.5 | 2.12 | |
| and | 56.3 | 57.0 | 0.7 | 2.31 | |
| and | 92.8 | 93.3 | 0.5 | 109.91 | |
| and | 118.6 | 121.7 | 3.1 | 1.14 | |
| and | 132.1 | 132.6 | 0.5 | 0.93 | |
| and | 153.0 | 155.4 | 2.4 | 1.51 | |
| and | 158.7 | 159.2 | 0.5 | 4.69 | |
| BR-23-404 | 54.8 | 55.3 | 0.5 | 4.13 | |
| and | 120.5 | 121.5 | 1.0 | 1.70 | |
| and | 180.7 | 181.2 | 0.5 | 1.64 | |
| BR-23-404A | 37.4 | 39.5 | 2.1 | 1.01 | |
| BR-23-405 | 87.5 | 88.1 | 0.6 | 3.82 | |
| and | 122.6 | 123.1 | 0.5 | 1.07 | |
| and | 129.8 | 130.3 | 0.5 | 1.87 | |
| and | 167.6 | 169.3 | 1.7 | 2.44 | |
| including | 168.4 | 169.3 | 0.9 | 4.33 | VG |
| and | 193.9 | 195.0 | 1.1 | 0.53 | |
| BR-23-406 | 185.4 | 187.9 | 2.5 | 0.85 | VG |
| and | 234.5 | 235.0 | 0.5 | 0.50 | |
| and | 288.2 | 288.7 | 0.5 | 0.84 | VG |
| and | 300.0 | 301.2 | 1.2 | 0.71 | |
| and | 307.7 | 308.2 | 0.5 | 1.11 | |
| BR-23-407 | 69.2 | 70.7 | 1.5 | 1.13 | |
| and | 217.1 | 217.6 | 0.5 | 3.73 |
Footnotes:
- Intervals are reported as core length only. True widths are estimated to be between 70% and 100% of the core length.
- All drill hole results are reported using fire assay only. See notes on QAQC procedures at the bottom of this press release.
- All drill holes not reported in the table above did not encounter significant mineralization, with the exception of drill holes BR-23-402.
- Drill holes were oriented along a north-south trend with holes on the north limb of the hosting anticlinal structure drilled southward and holes located south of the anticlinal structure drilled northward. The dip of holes is dependent upon the location relative to the anticline with the goal of intersecting mineralized zones orthogonally.


 Follow us on Twitter
 Become our facebook fan


Comments are closed.