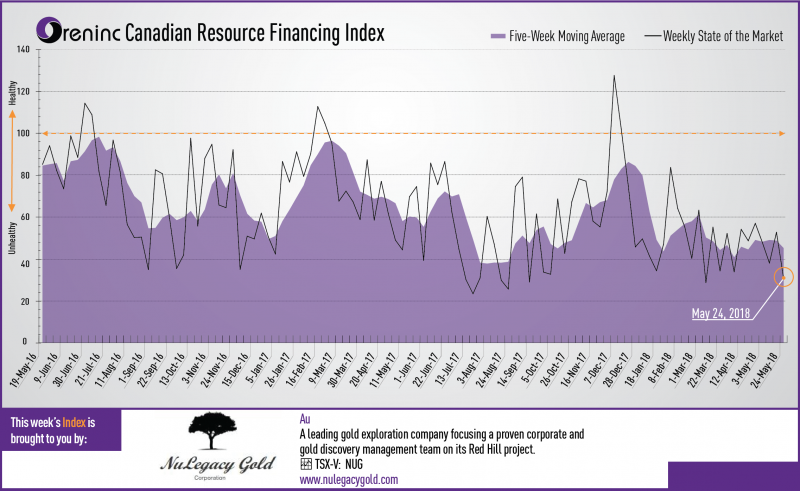
Last week index score: 52.74
This week: 30.90
The Oreninc Index fell in the week ending May 25th, 2018 to 30.90 from 52.74 a week ago despite gold recovering from the prior weeks’ fall below US$1,300/oz.
Gold recovered from a brief sojourn below the US$1,300/oz level as risk returned with US president Donald Trump calling off a landmark summit with North Korean leader Kim Jong Un. The yield on the US ten-year treasury fell below 3% as suggestions from the US Federal Reserve about a temporary rise in inflation raised questions over whether there will be multiple interest rate increases this year. All good news for gold. All eyes will be on the US Federal Reserve Open Market Committee meeting on June 12-13.
On to the money: total fund raises announced fell to C$38.8 million, an eleven-week low, which included two brokered financings for C$10.8 million, a two-week low and one bought deal financing for C$7.0 million, a two-week low. The average offer size fell to C$2.9 million, a three-week low and the number of financings fell to 13, an eleven-week low.
Gold closed at US$1,309/oz from US$1,293/oz a week ago. Gold is now down 0.04% this year. The US dollar index continued to increase and closed up at 94.25 from 93.63 a week ago. The Van Eck managed GDXJ made a slight gain after a volatile week closing up at US$32.89 from US$32.84 last week. The index is down 3.63% so far in 2018. The US Global Go Gold ETF fell slightly to close at US$12.93 from US$12.98 a week ago. It is now down 0.61% so far in 2018. The HUI Arca Gold BUGS Index closed up at 180.20 from 177.75 last week. The SPDR GLD ETF continued to sell off and closed its inventory at 848.50 tonnes from 855.28 tonnes a week ago.
In other commodities, silver made a small gain on a volatile week to close up at US$16.51/oz from US$16.44/oz a week ago. Copper showed a similar pattern to close up at US$3.07/lb from US$3.06/lb last week. Oil was the main loser of the week with its price taking a dump at the end of the week to close down at US$67.88 a barrel from US$71.28 a barrel a week ago.
The Dow Jones Industrial Average returned to growth to close up at 24,753 from 24,715 last week. Canada’s S&P/TSX Composite Index showed a slight loss to close down at 16,075 from 16,162 the previous week. The S&P/TSX Venture Composite Index also closed down at 775.41 from 786.39 last week.
Summary:
- Number of financings crumbled to 13, an eleven-week low.
- Two brokered financings were announced this week for C$10.8m, a two-week low.
- One bought-deal financing was announced this week for C$7.0m, a two-week low.
- Total dollars plunged to C$38.8m, an eleven-week low.
- Average offer size dropped to C$2.9m, a three-week low.
Financing Highlights
Probe Metals (TSX-V: PRB) opened a C$14 million financing.
- Bought deal with Sprott Capital Partners and a syndicate of underwriters
- Flow through units @ C$1.90 and non flow-through units @ C$1.15
- Each unit consists of one share and half a warrant exerciseable @ C$1.45 for two years.
- Underwriters option to purchase C$2.1 million in units.
- Gross proceeds will fund exploration on Probe’s projects in Québec.
- Closing is expected on June 19th.
Major Financing Openings:
- Great Bear Resources (TSX-V: GBR) opened a C$7.83 million offering on a best efforts basis. Each unit includes half a warrant that expires in 24 months.
- Probe Metals (TSX-V: PRB) opened a C$7 million offering underwritten by a syndicate led by Sprott Capital Partners on a bought deal basis. Each unit includes half a warrant that expires in 24 months. The deal is expected to close on or about June 19th.
- Probe Metals (TSX-V: PRB) opened a C$7 million offering on a best efforts basis. The deal is expected to close on or about June 19th.
- Para Resources (TSX-V: PBR) opened a C$6.4 million offering on a best efforts basis. Each unit includes a warrant that expires in 36 months.
Major Financing Closings:
- SRG Graphite (TSX-V: SRG) closed a C$8 million offering underwritten by a syndicate led by National Bank Financial on a best efforts basis. Each unit included a warrant that expires in 12 months.
- Wealth Minerals (TSX-V: WML) closed a C$6.25 million offering on a best efforts basis. Each unit included half a warrant that expires in 24 months.
- Zinc One Resources (TSX-V: Z) closed a C$3.89 million offering on a best efforts basis. Each unit included half a warrant that expires in 36 months.
- Alexandra Capital (TSX-V: AXC) closed a C$2.6 million offering on a best efforts basis.
About Oreinc.com:
Oreninc.com is North America’s leading provider of relevant financing information in the junior commodities space. Since 2011, the company has been keeping track of financings in the junior mining as well as oil and gas space. Logging all relevant deal and company information into its proprietary database, called the Oreninc Deal Log, Oreninc quickly became the go-to website in the mining financing space for investors, analysts, fund managers and company executives alike.
The Oreninc Deal Log keeps track of over 1,400 companies, bringing transparency to an otherwise impenetrable jungle of information. The goal is to increase the visibility of transactions and to show financings activity in a digestible format. Through its daily logging activities, Oreninc is in a position to pinpoint momentum changes in the markets, identify which commodities are trending and which projects are currently receiving funding.

The small contrarian gold-mining sector remains deeply out of favor, universally ignored. Thus the gold stocks are largely drifting listlessly, totally devoid of excitement. But that’s the best time to buy low, when few others care. The gold stocks continue to form strong technical bases, paving the way for massive mean-reversion uplegs. And they remain exceedingly cheap relative to gold prices, which drive their profits.
Being a gold-stock investor feels pretty miserable and hopeless these days. The gold stocks have been consolidating low for 14.2 months now, stuck in a seemingly-endless sideways grind. There are still gains to be won, but they are mostly within that low-trading-range context. We haven’t seen one of the huge uplegs gold stocks are famous for since the first half of 2016. So most traders have given up and moved on.
That’s understandable psychologically, but unfortunate for multiplying wealth. Sometimes it takes a while for gold stocks to catch a bid, but once they get moving they often soar. This sector is so small relative to broader stock markets that even minor shifts in capital flows can drive enormous gains. While it’s hard waiting for gold stocks to return to favor, the vast upside when they do is well worth the buying-low pain.
The leading gold-stock measure and trading vehicle is the GDX VanEck Vectors Gold Miners ETF. It was the original gold-stock ETF launched in May 2006, and still maintains a commanding advantage in popularity. This week, GDX’s net assets of $7.7b were 24.0x larger than its next-biggest 1x-long major-gold-stock-ETF competitor! GDX is as big as all the other gold-stock ETFs trading in the US combined.
GDX’s price action shows why gold stocks are such compelling investments when everyone hates them. After gold stocks were universally despised in mid-January 2016, GDX soared 151.2% higher in just 6.4 months! After the previous time sentiment turned so overwhelmingly against gold stocks in October 2008, GDX rocketed 307.0% higher over the next 2.9 years. Buying gold stocks low has proven very lucrative.
That quadrupling of GDX after 2008’s first-in-a-century stock panic was actually the tail end of a vastly-larger secular gold-stock bull. Many years before GDX was even a twinkle in its creators’ eyes, that gold-stock bull started stealthily marching higher out of total despair. It can’t be measured by GDX since that ETF started too late, but the classic HUI NYSE Arca Gold BUGS Index reveals the magnitude of that bull run.
Over 10.8 years between November 2000 and September 2011, the gold stocks as measured by the HUI skyrocketed an astounding 1664.4% higher! And that was during a long bear-market span in the general stock markets, where the flagship S&P 500 drifted 14.2% lower. The gains in gold miners’ stocks as they mean revert from out of favor to popular are so epically enormous that they far outweigh any time lost waiting.
Gold stocks are even more attractive today given the exceedingly-overvalued and dangerous US stock markets, which are on the verge of a long-overdue major bear. Market valuations remain deep in literal bubble territory despite early-February’s correction. The simple-average trailing-twelve-month price-to-earnings ratio of the elite S&P 500 stocks was still 31.5x at the end of last month, above the 28x bubble threshold!
The market-darling stocks investors love today are crazy-expensive, portending huge downside in the next bear. The most-popular stock among professional and individual investors alike is Amazon.com, a great company. Yet AMZN stock is now trading at a ludicrous 252.5x earnings! That means if profits held steady it would take new investors today a quarter millennium just to recoup their stock purchase price.
Meanwhile the world’s largest gold miner in 2017-production terms, Barrick Gold, is now trading at a TTM P/E of 9.5x. That’s dirt-cheap by any standards! And ABX’s profits-growth potential is greater than AMZN’s. Last year Barrick mined 5.32m ounces of gold at all-in sustaining costs of $750 per ounce. That was $508 under gold’s average price of $1258 last year, fueling fat full-year profits over $1.5b on $8.4b in sales.
Every 10% increase in prevailing gold prices boosts Barrick’s earnings by 25%. And the average gold price so far in 2018 is already up 5.7%, so gold miners’ profits are growing fast. I’m not a Barrick Gold investor, and am just using this leading major gold miner as an example. There are plenty of smaller mid-tier gold miners with far more upside profits leverage to gold prices. Gold stocks are darned attractive!
They are one of the last bargain sectors remaining in these overheated stock markets. They are one of the only sectors that can rally in major bear markets, because they follow gold which drives their profits. Gold investment demand surges in weak stock markets, which brings investors back to gold stocks. At some point, investors are going to figure out how compelling gold stocks are today and stampede back in.
Despite the apathetic sentiment plaguing them, the gold stocks are still looking fine technically and even better fundamentally. This first chart looks at gold-stock technicals as rendered by their dominant GDX ETF. Given how bearish traders have waxed on gold miners, you’d think they are spiraling relentlessly lower. But they are actually consolidating nicely, establishing a strong base from which to launch their next upleg.
After plunging to fundamentally-absurd all-time lows in mid-January 2016, GDX soared into a major new bull market. While its 151.2% surge in just 6.4 months was undoubtedly extreme, that emerged out of even-more-extreme lows. And it merely catapulted GDX to a 3.3-year high in early-August 2016, nowhere close to secular topping levels. But the gold stocks were very overbought then, and soon corrected hard.
GDX’s enormous 39.4% correction in 4.4 months after that initial bull peak was also extreme, the result of a couple major anomalies. First gold-futures stops were run on major gold support failing, which ignited parallel cascading stop-loss selling in the gold miners’ stocks. Then investors fled gold in the wake of Trump’s surprise election victory, which led stock markets to soar on widespread hopes for big tax cuts soon.
Gold-stock selling finally exhausted itself in mid-December 2016, the day after the Fed’s 2nd rate hike of this cycle. Just a couple weeks later, GDX entered its now-14.2-month-old trading range that persists to this day. It is a basing consolidation trend running from $21 support to $25 resistance, which makes for a 19.0% trading range. This has held rock solid ever since, which has made gold-stock trading fairly easy.
My strategy has been simple. Given the extreme undervaluations in gold stocks that I’ll discuss shortly, a massive new upleg is likely to ignite anytime. So I want a full trading book to reap those enormous gains when they inevitably arrive. Thus every time GDX slumped down into the lower quarter of its consolidation range, between $21 to $22, I’ve been adding positions in great mid-tier gold miners with superior fundamentals.
All this is shared in real-time with our newsletter subscribers, who graciously support our research work. Buying low in the context of this vexing gold-stock consolidation has driven some great trades despite lackluster overall action. One example is Kirkland Lake Gold, an elite mid-tier miner. I added a new position in our popular weekly newsletter in December 2016. A year later I sold it for a hefty 184% realized gain!
So while this gold-stock trading range has sure felt dull, it has still created plenty of trading opportunities. And over the past month or so since that sharp stock-market correction, GDX has largely meandered in that lower quarter of its range near support again. That means it’s an excellent time to deploy capital in the unloved and cheap gold miners’ stocks today. Another surge higher is due, and it could be a big one.
While GDX $21 support has proven strong since the end of 2016, so has GDX $25 resistance. The gold stocks have tried and failed to break out above $25 four separate times since early 2017. A couple of the attempts were close, but weren’t sustainable as gold retreated. Once that $25 breakout finally comes to pass, investors will realize something different is happening and rush to chase gold stocks’ upside momentum.
Before early February’s sharp stock-market plunge that changed everything, I was looking to the release of gold miners’ Q4’17 operating and financial results as a potential catalyst to fuel that $25 breakout. That didn’t happen though, as gold and especially gold stocks were sucked into the fear surrounding the unprecedented stock-market volatility shock a month ago. That dragged GDX back down near support, which held.
This recent support approach is probably a blessing in disguise, offering another chance for investors to deploy capital in cheap gold stocks before they really start moving again. The great and sad paradox of the markets is investors are least willing to buy when stocks are low and out of favor, which is the exact time they should be buying before later selling high. Gold-stock prices can’t and won’t stay this low forever.
With stock-market volatility back, the highly-likely catalyst to ignite that GDX $25 breakout is gold rallying on resurgent investment demand. Gold is largely ignored when stock markets are high and investors are euphoric, as they feel no need to prudently diversify their portfolios. But once stock markets sell off for long enough to spook investors, they start shifting capital back into gold which often moves counter to stocks.
With the US stock markets still trading deep into bubble territory in late February, and euphoria remaining rampant as evidenced by the blistering bounce rally following that early-month plunge, there’s no way the stock-market selling is over yet. It will have to resume sooner or later with a vengeance to actually start rebalancing away greedy sentiment. When that happens, gold and gold stocks will soon catch major bids.
The fact gold stocks have held strong in their consolidation trading range for well over a year now is a glass-half-full kind of thing. It testifies to relatively-strong investment demand given the terribly-bearish sentiment pervasive in this sector. The longer prices base during bull markets, the greater the upside potential in their next upleg. It likely won’t take much of a gold rally to blast GDX back up through $25 again.
This strong technical picture and an inevitable sentiment mean reversion are reason enough for gold stocks to surge dramatically higher. But supercharging that is the dirt-cheap state of gold stocks today in fundamental terms. That includes current gold-mining profits compared to prevailing gold-stock prices, as well as near-future earnings-growth potential as gold itself continues mean reverting much higher ahead.
I’m well into my quarterly research work analyzing the Q4’17 results from the major gold miners of GDX. Unfortunately due to the complexities of preparing annual reports, the Q4 reporting season up to 90 days after quarter-ends is double the 45-day deadlines for Q1s through Q3s. So all the data isn’t quite in yet, but I expect to have enough to delve deeply into the major gold miners’ Q4’17 results in next Friday’s essay.
In the meantime, a great fundamental proxy for gold-stock valuations is the HUI/Gold Ratio. This is as simple as it sounds, dividing the daily close of that classic gold-stock index by the daily gold close and charting the resulting ratio over time. This reveals when gold stocks are expensive or cheap relative to the metal which drives their profits. And this sector has rarely been more undervalued than it is today!
This week the HGR was way down at 0.131x, meaning the HUI index’s close was running just over 13% of gold’s close. That’s incredibly low historically, showing that the gold miners’ stocks have been wildly underperforming gold. The gold stocks are trading at levels today implying gold and their profits were radically lower. This is a colossal fundamentally-absurd disconnect that can’t last forever, it has to unwind.
GDX and the HUI were way down at $21.57 and 173.4 in the middle of this week. The first time the HUI ever hit this level was way back in August 2003, years before GDX was even born. Back then gold was only running $357, and had yet to trade above $380 in its entire young secular bull. Let that sink in for a second. Gold stocks are trading at prices today first seen when gold was in the $350s fully 14.6 years ago!
This week gold was trading near $1325, an enormous 3.7x higher. That should certainly be reflected in gold miners’ stocks. Today’s super-low gold-stock levels aren’t much above the HUI’s stock-panic lows back in October 2008. There was only a week where the HUI traded lower than today at peak fear in the stock markets, and gold averaged $732 during that extreme span. This week it was trading 81% higher!
This is incredibly illogical, only explainable by irrational sentiment. If any other stock-market sector was trading at levels from a decade or more earlier despite the selling prices of its products doubling to quadrupling, investors would be beating down the doors to buy. That would rightfully be seen as a huge and unsustainable anomaly, a rare chance to buy deeply-undervalued stocks at decade-plus-old prices.
And it’s not just gold that’s far higher, so are the profit margins for mining it. With the new Q4’17 results from GDX’s major gold miners not all out yet, the latest data we have this week is Q3’17’s. During that previous quarter, the top GDX miners averaged all-in sustaining costs of just $868 per ounce. The costs of mining gold industrywide don’t change much, which is what creates profits’ big upside leverage to gold prices.
My still-incomplete Q4’17 analysis shows AISCs very similar to last quarter’s. That makes sense, as the past year’s quarters ending in Q3’17 had collective GDX AISCs of $875, $878, $867, and $868. Mining gold costs similar amounts regardless of prevailing gold prices, at least over medium-term multi-year spans too short for new gold mines to be built. So Q4’17 AISCs are likely to remain around these levels.
Assuming $868 carries forward into Q4’17 and Q1’18, gold-mining profits are really growing. Average gold prices surged from $1276 in Q4 to $1330 quarter-to-date in Q1. That’s up 4.2% sequentially, really strong. This implies major gold miners’ earnings are surging 13.2% QoQ in our current Q1’18 from $408 to $462 per ounce! That would make for strong 3.1x upside profits leverage to gold, which is impressive.
And whether the major gold miners are collectively earning $400, or $450, or even $500 per ounce today, such profits alone are much greater than the $350s prevailing gold price the first time the HUI traded at today’s levels. With fat profits like this heading much higher as this gold bull continues, it’s ridiculous for gold stocks to be priced as if gold was still in the $350s like mid-2003 or the $730s like in 2008’s stock panic.
This extreme anomaly can’t and won’t last. The gold stocks should be priced for today’s prevailing gold prices around $1325. The first time gold hit $1325 in October 2010, the HUI was trading at 522. That is triple today’s ludicrous levels! The gold stocks more than quadrupled in the years following 2008’s stock panic, another irrational situation where sentiment had battered gold stocks to fundamentally-absurd levels.
Between that first-in-a-century stock panic and extreme central-bank easing that really hit full steam in 2013, the last quasi-normal years in the markets were 2009 to 2012. During that post-panic span the HGR averaged 0.346x. If the HUI would merely mean revert back up to those levels relative to gold, it would have to soar to 458. That’s 164% higher than this week’s levels, upside unparalleled in any other sector.
For 5 years before the stock panic, the HGR averaged 0.511x. While gold stocks might not be able to sustain levels so high anymore, they could certainly blast up there in a temporary mean-reversion overshoot. After extremes, prices don’t simply migrate back to the average. Instead they overshoot proportionally to the opposing extreme as sentiment is equalized. That implies a HUI level of 677, 290% higher from here.
No one knows how high gold stocks can go, but there is zero doubt they are radically undervalued given today’s gold prices and the gold-mining profits they generate. Whether you expect this battered sector to quadruple again like after the stock panic, or merely double, that dwarfs the potential of the rest of the stock markets. Especially with the S&P 500 trading at bubble valuations after a long central-bank-goosed bull.
The gold stocks are truly a coiled spring today, ready to explode higher soon and trounce everything else. They are deeply out of favor, incredibly undervalued, and one of the only sectors that can rally sharply when general stock markets sell off. If you want to multiply your wealth this year by fighting the crowd to buy low then sell high, this small and forgotten contrarian sector is the place to be. Nothing else rivals it.
While investors and speculators alike can certainly play gold stocks’ coming powerful upleg with the major ETFs like GDX, the best gains by far will be won in individual gold stocks with superior fundamentals. Their upside will far exceed the ETFs, which are burdened by over-diversification and underperforming gold stocks. A carefully-handpicked portfolio of elite gold and silver miners will generate much-greater wealth creation.
At Zeal we’ve literally spent tens of thousands of hours researching individual gold stocks and markets, so we can better decide what to trade and when. As of the end of Q4, this has resulted in 983 stock trades recommended in real-time to our newsletter subscribers since 2001. Fighting the crowd to buy low and sell high is very profitable, as all these trades averaged stellar annualized realized gains of +20.2%!
The key to this success is staying informed and being contrarian. That means buying low before others figure it out, before undervalued gold stocks soar much higher. An easy way to keep abreast is through our acclaimed weekly and monthly newsletters. They draw on my vast experience, knowledge, wisdom, and ongoing research to explain what’s going on in the markets, why, and how to trade them with specific stocks. For only $12 per issue, you can learn to think, trade, and thrive like contrarians. Subscribe today, and get deployed in the great gold and silver stocks in our full trading books!
The bottom line is gold stocks are basing technically and cheap fundamentally today. While this small contrarian sector has largely been forgotten, its past year’s consolidation trading range continues to hold solid. The longer the basing, the greater the potential upleg when investors return. And despite trading at levels implying vastly-lower gold prices, the major gold miners are actually earning fat profits today.
Those earnings will surge dramatically as gold continues powering higher in its own bull market. It’s only a matter of time until investors see the extreme market-leading value inherent in the gold miners’ stocks. And with stock-market volatility roaring back after long years of central-bank suppression, diversifying portfolios with gold will soon return to favor. The gold stocks will soar as investment buying drives gold higher.
Adam Hamilton, CPA
March 9, 2018
Copyright 2000 – 2018 Zeal LLC (www.ZealLLC.com)
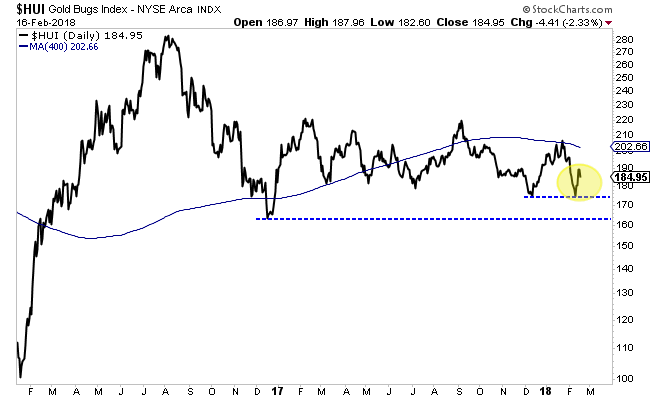
Gold has been on the cusp of a major breakout but someone forgot to tell the gold stocks. Gold is right back at resistance levels yet the various gold stock indices are off their September 2017 highs by 11% to 16%. The relative weakness in the gold stocks (and Silver) is a signal that Gold is unlikely to breakout now. In fact, if Gold were to correct here the gold stocks could threaten support and perhaps make new lows. While that sounds quite bearish, history shows that a break to new lows in gold stocks would be a massive buy signal.
The history we refer to is the path of recovery for a market following a mega-bear, which we define as nearly 3 years and at least an 80% decline. There are three strong historical examples. Those are the S&P 500 during the Great Depression, Thailand after its bust in the mid to late 90s and the housing stocks after 2005 to the March 2009 low. The recovery in each (following the mega-bear) followed three distinct phases. There is a sharp initial rebound which is followed by a correction and lengthy consolidation which lasts at least 18 months. Eventually, the long consolidation ends and the market surges higher in an impulsive fashion.
The gold stocks are currently in the 19th month of their correction and consolidation. They bounced from support in December but retraced that entire bounce. After a second rebound from support, they could threaten a break of that support. Below we show the HUI Gold Bugs Index which does not include the royalty companies as GDX does. The HUI is not too far from its December 2016 low and could even break it if Gold were to correct.
Conventional technical analysis would imply that is a sell signal for the gold stocks.
But history argues the complete opposite.
In the 21st month of its correction and consolidation in 1935, the S&P 500 had broken down to a 2-year low. Was the market headed for a retest of the Great Depression low?

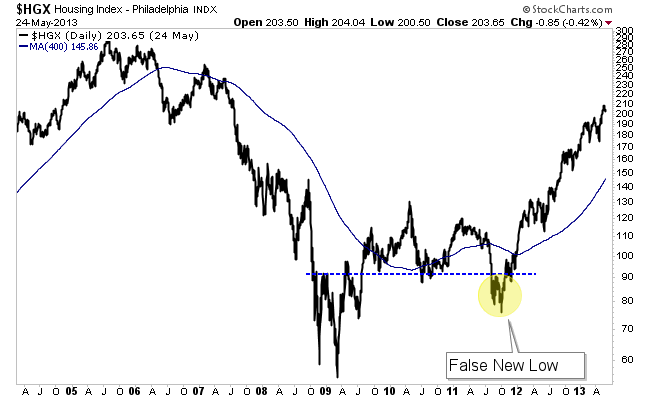
In the 19th month of its consolidation in the fall of 2011, housing stocks had broken to a 2-year low. Was the sector headed for a retest of the Global Financial Crisis low?
Thailand’s correction and consolidation phase was different than the others as it made its low only 15 months in but then consolidated and grinded slightly higher for the next 13 months before exploding to the upside. At its corrective price low 15 months in the index was at a 2-year low.
The HUI closed Friday just below 185. Its December 2016 low is 163.49. A 12% decline would put it below its December 2016 low and at a 2-year low.
The three historical examples all made 2-year lows before their correction and consolidation phase ended.
A potential failed breakout or correction in Gold could leave gold stocks vulnerable to a decline to new lows. While that sounds bearish, the historical context argues otherwise. Two of the three historical examples that show similarities to the gold stocks broke to new lows. Yet that break proved to be the best buying opportunity since bear market low. All three of the historical examples made 2-year lows before exploding higher. History shows that if the HUI Gold Bugs Index were to break to new lows it could be a false break and a massive buy signal. Quality juniors that are bought on forthcoming weakness (if Gold corrects) should deliver fantastic returns over the ensuing 12 to 18 months. To follow our guidance and learn our favorite juniors for the next 12-18 months, consider learning about our premium service.
The gold miners’ stocks have huge upside potential in 2018, likely the best among stock-market sectors. They really lagged gold last year, so a major mean-reversion catch-up rally is coming. The gold miners are universally ignored and deeply undervalued relative to the metal which drives their profits. And gold itself is likely to power dramatically higher this year as euphoric record-high stock markets inevitably start to falter.
Gold has always been the leading contrarian investment, tending to move counter to stock markets. So not surprisingly investment demand stalled last year as the extreme taxphoria-fueled stock surge blasted relentlessly higher. When stock markets apparently do nothing but rally indefinitely, investors feel no need to prudently diversify their portfolios with the anti-stock trade gold. So they ignored the yellow metal in 2017.
That was certainly evident in the leading proxy for gold investment demand, the flagship American GLD SPDR Gold Shares gold ETF. Its physical gold bullion held in trust for shareholders merely grew 1.9% or 15.3 metric tons in 2017. That was a colossal slowdown from 2016’s massive 28.0% or 179.8t growth! Given the weak gold investment demand last year, it’s rather impressive how well gold managed to perform.
Big up-years in the stock markets sometimes drive big down-years in gold, and 2013 was a key case in point. That year extreme Fed easing catapulted the benchmark S&P 500 broad-market stock index (SPX) an amazing 29.6% higher. Exuberant investors wanted nothing to do with gold, and dumped it in droves. So the gold price plummeted 27.9% in 2013, leaving deep psychological damage that persists to this day.
In 2017 the SPX soared 19.4% on hopes for big tax cuts soon from the newly-Republican-controlled US government. Extreme complacency, greed, euphoria, and even hubris ran rampant among investors. It was a perfect scenario to see gold crushed again on a mass exodus of investor capital. Yet despite the stock markets enjoying their best year since 2013, gold was still able to achieve a strong 13.2% gain in 2017!
Nevertheless, the wildly-optimistic stock-market sentiment drowned out everything else so psychology in precious metals remained exceptionally weak. The leading indicators for gold sentiment are this metal’s peripheral leveraged plays of silver and gold miners’ stocks. Both typically amplify gold’s upside by 2x to 3x. But oddly in 2017 despite gold’s big rally, silver and the main gold-stock index only climbed 6.4% and 5.5%.
That index is of course the NYSE Arca Gold BUGS Index, better known by its symbol HUI. It is closely mirrored by the dominant gold-stock ETF, the GDX VanEck Vectors Gold Miners ETF. The composition of these gold-stock trackers is very similar by necessity, as the universe of major gold miners to pick from when building indexes is small. Without scales, it’s impossible to tell the difference between HUI and GDX charts.
In a 13.2% gold up-year like 2017, the HUI really should’ve leveraged that by 2x to 3x to enjoy solid annual gains of 26.4% to 39.7%. Yet because investors weren’t interested in either gold or its miners’ stocks, the HUI languished with that miserable 5.5% gain last year. That made for terrible 0.4x leverage to gold, which is wildly unacceptable. Gold miners must generate greater returns than gold to be viable investments.
Owning gold miners is much riskier than simply owning gold itself. On top of all the price risks that gold faces, the miners heap many additional operational, geological, and geopolitical challenges. They must compensate investors for these considerable added risks relative to owning gold outright, or there is truly no point in owning them at all. 2017 was a rare anomaly where they dramatically lagged gold’s solid rally.
That’s very unlikely to persist into 2018, as we’re already seeing. Since the Fed’s 5th rate hike of this cycle in mid-December, gold and the HUI have rallied 5.5% and 12.8% as of the middle of this week. That makes for solid 2.3x upside leverage, already a vast improvement over last year’s 0.4x. Thus investors are already returning to gold stocks in a meaningful way, and this young trend should accelerate.
The gold miners’ stocks are radically undervalued fundamentally after so horribly underperforming gold last year. Gold mining is a simple business from a profits standpoint. Miners painstakingly wrest gold from the bowels of the Earth, then sell it at prevailing market prices. So their earnings are the differences between current gold prices and mining costs. Gold-mining profitability was actually fairly strong in 2017.
Right after quarterly earnings seasons, I dig into the newest reports from the world’s top gold miners included in that leading GDX gold-stock ETF. In their latest-reported quarter of Q3’17, the top 34 GDX component gold miners averaged all-in sustaining costs of $868 per ounce. AISCs are this industry’s main profitability measure, accounting for not only mining but maintaining production by replenishing reserves.
One of the primary attributes that makes gold stocks so attractive to investors is the fact these costs don’t change much regardless of prevailing gold prices. Over the past 7 quarters ending in Q3’17, GDX’s top-34 gold miners reported average AISC of $833, $886, $855, $875, $878, $867, and $868. That makes for a tight variance, despite gold trading as low as $1074 and as high as $1365 during this same span.
These quarterly major-gold-miner average AISCs within this gold bull have their own mean of $866, so let’s assume this industry can operate at $865 all-in sustaining costs. In 2017 gold averaged $1258 per ounce, so the major gold miners were collectively earning profits of $393 per ounce. That equates to hefty 31% profit margins, levels most industries would die for. Yet gold-mining stocks certainly didn’t reflect this!
The HUI averaged just 196.0 in 2017, incredibly-low levels. This leading gold-stock index first hit 196 in September 2003 when gold was only trading near $375. Back then the major gold miners were far less profitable in both absolute and percentage terms. In 2004 the HUI averaged 212.2, considerably better than 2017 levels despite gold’s super-low average price of $409 that year. Today’s gold-stock prices are absurd!
In 2010 the gold price averaged $1228, a bit below 2017’s $1258. Yet the HUI averaged 471.5, or a whopping 141% higher than last year’s ridiculous levels. The gold miners’ stocks are now priced as if this industry was operating at massive cashflow losses with its very future viability called into question. Yet obviously that isn’t the case, as the gold miners are generating big positive cashflows and profits today.
The only explanation for this epic fundamental anomaly is extreme sentiment, which never lasts for long. Because the stock markets soared in taxphoria last year, investors shunned gold and everything related to it. Thus the gold stocks fell deeply out of favor, universally ignored if not scorned. When that weird psychology inevitably shifts, the beaten-down gold stocks are going to stage a massive catch-up upleg.
There’s plenty of precedent for that. Back in early 2016 when the general stock markets suffered their last correction, gold investment demand exploded for prudently diversifying stock-heavy portfolios. The SPX only fell 13.3% over 3.3 months, but even that minor correction was enough to rekindle big gold buying. That catapulted gold 29.9% higher in 6.7 months, birthing its first new bull market since 2011!
Like today, gold stocks were neglected and anomalously-cheap before that last stock-selloff-driven gold upleg. Then in roughly that same first-half-of-2016 span, the HUI skyrocketed 182.2% higher in just 6.5 months! That made for amazing 6.1x upside leverage to gold. When gold stocks have underperformed their metal, their catch-up rallies are huge and greatly amplify gold’s gains. 2018’s action should echo 2016’s.
Gold stocks certainly have the potential today to see similar fast gains this year to their near-triple in a half-year on gold powering less than a third higher a couple years ago! The lead-in to 2018 was very similar to that lead-in to 2016, with gold stocks deeply out of favor and thus languishing at fundamentally-absurd price levels relative to their profits. But the vast majority of traders haven’t figured this out yet.
Investment is all about buying low then selling high, and that requires buying when assets are unpopular and thus underpriced. Unfortunately most investors ultimately perform poorly because they reverse this. They instead wait to buy until assets are adored, which forces them to buy really high. Then once those assets inevitably mean revert to much-lower levels, investors succumb to popular fear and sell low for big losses.
In late 2015 just like in late 2017, the contrarian gold-stock sector was despised. Few investors were even aware of it, and most of those didn’t want to touch it with a ten-foot pole. Yet in 2016, the gold stocks were the best-performing stock-market sector. The HUI rocketed 64.0% higher that year on a mere 8.5% gold rally, trouncing the SPX’s 9.5% gain! Fighting the crowd to buy low really multiplies wealth.
There’s a high probability the gold miners’ stocks will once again prove the best-performing stock-market sector in 2018. There’s virtually nothing else deeply out of favor and radically undervalued in these entire taxphoria-inflated stock markets! Everything else has already been bid dramatically higher, and thus is susceptible to suffering sharp selloffs as the stock markets roll over. Gold stocks are the only bargains left.
Since prevailing gold prices directly drive gold-mining profitability and hence ultimately stock prices, the HUI/Gold Ratio is a great valuation proxy for this sector. It simply divides the daily HUI close by the daily gold close. When charted over time, this core fundamental relationship reveals when gold stocks are overvalued or undervalued relative to gold. And there’s no doubt the latter is true in spades heading into 2018.
Despite the gold miners’ nice post-FOMC-meeting rally in recent weeks, they left 2017 trading at an HGR of just 0.148x. In other words, the HUI was trading at just under 15% of the gold price. This ratio means nothing in isolation, but years of history shows when gold stocks are high or low compared to gold. And they almost couldn’t be lower today, or more undervalued. Essentially only 2015 saw worse gold-stock prices.
That happened to be the climaxing stretch of a major gold bear that ran 6.1 years leading into the Fed’s first rate hike of this cycle in December 2015. The HGR slumped to all-time lows near 0.09x late that year, extreme and unsustainable. And indeed the gold stocks rallied sharply out of that anomaly, again nearly tripling in a half-year. Gold-stock prices remain super-low, overdue to mean revert dramatically higher.
This long-term HGR chart encompasses a 15-year secular span that included every conceivable market condition for gold and its miners’ stocks. The HGR averaged 0.341x through all of it, or fully 2.3x higher than today’s extreme lows. That means the gold stocks as measured by the HUI ought to be trading at least 127% higher than today’s levels! And that’s assuming gold just stalls out instead of rallying further.
Instead 2018 is almost certain to see gold surge dramatically higher in its next major bull-market upleg. That leaves the gold stocks with early-2016-like potential to skyrocket again, greatly outperforming gold until their stock prices catch up or more likely overshoot to the upside. The driver will once again be these euphoric stock markets rolling over into their next correction or more likely the long-overdue bear market.
Despite the extreme stock euphoria as 2018 dawns, today’s stock markets are hyper-risky. They have powered higher for years now on extreme central-bank easing before the recent taxphoria. But that has forced them to exceedingly-dangerous bubble valuations. The SPX left 2017 with its elite component stocks sporting an average trailing-twelve-month price-to-earnings ratio of 30.7x, above the 28x bubble threshold!
The SPX has now gone 1.9 years without a 10%+ correction, and such selloffs tend to happen at least once a year in healthy bull markets. Now that the highly-anticipated Republican corporate tax cuts have indeed come to pass, 2017’s taxphoria will naturally fade. The more-optimistic Wall Street estimates are for those tax cuts to boost corporate earnings by 10% in 2018, which still won’t justify today’s lofty stock prices.
If this year sees SPX earnings indeed grow 10%, that still leaves its components’ average P/E ratio way up at a near-bubble 27.6x! Stock valuations are so extreme after an extraordinary 8.8-year 301.0% SPX bull market that the biggest US corporate tax cuts ever will barely put a dent in bubble valuations. That leaves stock markets at risk for their first correction-grade selloff since early 2016, which is great news for gold.
But the real coup de grâce to these euphoric record stock markets will be this year’s enormous central-bank tightening radically unprecedented in history. The Fed’s new quantitative-tightening campaign is ramping up in 2018, starting to unwind years of epic quantitative easing. And the European Central Bank is sharply tapering its own QE bond buying by slashing it in half. Together this will strangle this stock bull.
There is nothing more important to the global markets this year than this unparalleled tightening by both the Fed and ECB. I wrote a whole essay analyzing it in depth back in late October, which every investor needs to understand! Compared to 2017, 2018 and 2019 will respectively see $950b and $1450b more tightening and less easing from the Fed and ECB! Nothing remotely like this has ever before been witnessed.
When these central-bank-easing-inflated record stock markets face the biggest central-bank tightening in world history, while trading at bubble valuations no less, the only possible outcome is a serious selloff. At best it will be a major correction approaching 20% in the SPX, but far more likely a new bear market. Those tend to run near 50% losses over a couple years, annihilating wealth of investors who get trapped in them.
Just like in early 2016, the long-overdue next major stock-market selloff will quickly rekindle major gold investment demand. Investors will remember gold when their stock-heavy portfolios start tanking, and rush to diversify into it. The reason gold rallied 29.9% in roughly the first half of 2016 is investors flooded back into gold following the last SPX correction. That was led by American investors heavily buying GLD shares.
This dominant global gold ETF saw its holdings skyrocket 55.7% or 351.1t over that same short span! That was just after a 13.3% SPX correction. Imagine the gold investment demand if we approach 20% or go beyond into the inevitable next bear. The differential GLD-share buying forcing stock-market capital into physical gold bullion could very well be unprecedented. That’s exceedingly bullish for gold stocks!
When this gold-demand-killing stock euphoria inescapably breaks, gold could easily power another 30% higher in 2018. But let’s be conservative and look for a 20% upleg, which would leave gold near $1563. That’s still well below gold’s all-time high of $1894 in August 2011, not extreme by any measure. Gold was above $1550 almost continuously for 1.8 years between July 2011 to April 2013, we’ve seen it before.
At $1565 gold and those top-34 GDX gold miners’ average all-in sustaining costs of $865 during this gold bull, their profits would soar to $700 per ounce! That’s 78% above 2017 levels. There’s nowhere else in all the stock markets where such huge earnings growth is even possible, let alone probable. Such a big surge in profits coupled with excessively-low gold-stock prices would lead to huge fundamentally-driven gains.
At $1565 gold and that 15-year-average 0.341x HGR, that implies the HUI fair value is around 534. That is 170% above this week’s gold-stock levels. Thus much like early 2016, the gold stocks truly have the potential to nearly triple again in 2018 on higher gold prices! Even better, after being excessively low the gold stocks tend to not just mean revert but overshoot to overvaluations. So their upside potential is huge.
The gold stocks are really a coiled spring today, ready to explode higher in 2018 and trounce everything else. They are deeply out of favor, incredibly undervalued, and one of the only sectors that can rally sharply when general stock markets sell off. If you want to multiply your wealth this year by fighting the crowd to buy low then sell high, this small and forgotten contrarian sector is the place to be. Nothing else rivals it.
While investors and speculators alike can certainly play gold stocks’ coming powerful upleg with the major ETFs like GDX, the best gains by far will be won in individual gold stocks with superior fundamentals. Their upside will far exceed the ETFs, which are burdened by over-diversification and underperforming gold stocks. A carefully-handpicked portfolio of elite gold and silver miners will generate much-greater wealth creation.
At Zeal we’ve literally spent tens of thousands of hours researching individual gold stocks and markets, so we can better decide what to trade and when. As of the end of Q3, this has resulted in 967 stock trades recommended in real-time to our newsletter subscribers since 2001. Fighting the crowd to buy low and sell high is very profitable, as all these trades averaged stellar annualized realized gains of +19.9%!
The key to this success is staying informed and being contrarian. That means buying low before others figure it out, before undervalued gold stocks soar much higher. An easy way to keep abreast is through our acclaimed weekly and monthly newsletters. They draw on my vast experience, knowledge, wisdom, and ongoing research to explain what’s going on in the markets, why, and how to trade them with specific stocks. For only $12 per issue, you can learn to think, trade, and thrive like contrarians. Subscribe today, and get deployed in the great gold and silver stocks in our full trading books!
The bottom line is gold-stock upside potential is huge in 2018. The gold miners really lagged gold last year due to the extreme stock euphoria gutting gold sentiment. That left gold stocks deeply out of favor and exceedingly cheap relative to the metal which drives their profits. This extreme anomaly won’t last for long, as investors will flood back into these fundamental bargains as gold starts powering higher again.
Gold investment demand is set to surge again when these euphoric stock markets inevitably roll over into their next major selloff. The likely trigger will be massive central-bank tightening at wildly-unprecedented levels. The last time stock markets corrected, gold shot up almost a third while gold stocks nearly tripled in merely a half-year! 2018 is perfectly set up for a similar scenario, portending massive gold-stock gains.
Adam Hamilton, CPA
January 5, 2018
Copyright 2000 – 2018 Zeal LLC (www.ZealLLC.com)
The gold miners’ stocks have largely ground sideways this year, consolidating their massive 2016 gains. That lackluster trading action, along with vexing under performance relative to gold, has left gold stocks deeply out of favor. But these uninspiring technicals and resulting bearish sentiment should soon shift. The gold stocks are just now entering their strongest seasonal rally of the year, the super-bullish winter rally.
Gold-stock performance is highly seasonal, which certainly sounds odd. The gold miners produce and sell their metal at relatively-constant rates year-round, so the temporal journey through calendar months should be irrelevant. Based on these miners’ revenues, there’s little reason investors should favor them more at certain times of the year than others. Yet history proves that’s exactly what happens in this sector.
Seasonality is the tendency for prices to exhibit recurring patterns at certain times during the calendar year. While seasonality doesn’t drive price action, it quantifies annually-repeating behavior driven by sentiment, technicals, and fundamentals. We humans are creatures of habit and herd, which naturally colors our trading decisions. The calendar year’s passage affects the timing and intensity of buying and selling.
Gold stocks exhibit strong seasonality because their price action mirrors that of their dominant primary driver, gold. Gold’s seasonality generally isn’t driven by supply fluctuations like grown commodities experience, as its mined supply remains fairly steady all year long. Instead gold’s major seasonality is demand-driven, with global investment demand varying dramatically depending on the time within the calendar year.
This gold seasonality is fueled by well-known income-cycle and cultural drivers of outsized gold demand from around the world. And the biggest seasonal surge of all is just now getting underway heading into winter. As the Indian-wedding-season gold-jewelry buying that drives this metal’s big autumn rally winds down, the Western holiday season is ramping up. The holiday spirit puts everyone in the mood to spend money.
Men splurge on vast amounts of gold jewelry for Christmas gifts for their wives, girlfriends, daughters, and mothers. The holidays are also a big engagement season, with Christmas Eve and New Year’s Eve being two of the biggest proposal nights of the year. Between a quarter to a third of the entire annual sales of jewelry stores come in November and December! And jewelry historically dominates overall gold demand.
According to the World Gold Council, between 2010 to 2016 jewelry accounted for 49%, 44%, 45%, 60%, 58%, 57%, and 47% of total annual global gold demand. That averages out to just over half, which is much larger than investment demand. During those same past 7 years, that ran 39%, 37%, 34%, 18%, 20%, 22%, and 36% for a 29% average. Jewelry demand remains the single-largest global gold demand category.
That frenzied Western jewelry buying heading into winter shifts to pure investment demand after year-end. That’s when Western investors figure out how much surplus income they earned during the prior year after bonuses and taxes. Some of this is plowed into gold in January, driving it higher. Finally the big winter gold rally climaxes in late February on major Chinese New Year gold buying flaring up in Asia.
So during its bull-market years, gold has always tended to enjoy major winter rallies driven by these sequential episodes of outsized demand. Naturally the gold stocks follow gold higher, amplifying its gains due to their great profits leverage to the gold price. Today gold stocks are once again now heading into their strongest seasonal rally of the year driven by this robust winter gold demand. That’s super-bullish!
Since it’s gold’s own demand-driven seasonality that fuels the gold stocks’ seasonality, that’s logically the best place to start to understand what’s likely coming. Price action is very different between bull and bear years, and gold is absolutely in a young bull market. After being crushed to a 6.1-year secular low in mid-December 2015 on the Fed’s first rate hike of this cycle, gold powered 29.9% higher over the next 6.7 months.
Crossing the +20% threshold in early March 2016 confirmed a new bull market was underway. Gold corrected after that sharp initial upleg, but normal healthy selling was greatly exacerbated following Trump’s surprise election win. Investors fled gold to chase the Trumphoria stock-market surge. Gold’s correction cascaded to monstrous proportions, hitting -17.3% in mid-December. But that was shy of a new bear’s -20%.
Gold’s last mighty bull market ran from April 2001 to August 2011, where it soared 638.2% higher! And while gold consolidated high in 2012, that was technically a bull year too since gold just slid 18.8% at worst from its bull-market peak. Gold didn’t enter formal bear-market territory at -20% until April 2013, thanks to the crazy stock-market levitation driven by extreme distortions from the Fed’s QE3 bond monetizations.
So the bull-market years for gold in modern history ran from 2001 to 2012, skipped the intervening bear-market years of 2013 to 2015, and resumed in 2016 to 2017. Thus these are the years most relevant to understanding gold’s typical seasonal performance throughout the calendar year. We’re interested in bull-market seasonality, because gold remains in its young bull today and bear-market action is quite dissimilar.
This chart averages the individually-indexed full-year gold performances in those bull-market years from 2001 to 2012 and 2016. 2017 isn’t included in this analysis yet since it remains a work in progress. This chart distills out gold’s bull-market seasonal tendencies in like percentage terms. Quantifying gold’s bull-market seasonal tendencies requires all relevant years’ price action to be recast to be perfectly comparable.
That’s accomplished by individually indexing each calendar year’s gold price action to its final close of the preceding year, which is recast at 100. Then all gold price action of the following year is calculated off that common indexed baseline, normalizing all years regardless of price levels. So gold trading at an indexed level of 105 simply means it has rallied 5% from the prior year’s close, while 95 shows it’s down 5%.
This methodology renders all bull-market-year gold performances in like percentage terms. That’s critical since gold’s price range has been so vast, from $257 in April 2001 to $1894 in August 2011. Finally each calendar year’s individually-indexed gold prices are averaged together to arrive at this illuminating gold-bull seasonality. Gold has always had a strong tendency to enjoy major winter rallies, starting right about now.
During its modern bull-market years from 2001 to 2012 and 2016, gold’s major winter rally started on average in late October. Technically gold’s key seasonal bottom averaged being carved on that month’s 16th trading day, which was October 23rd this year. From there gold surges into its strongest seasonal rally of the year. Between late October and late February in these bull years, gold blasted 9.5% higher on average!
These big winter-rally seasonal gains are much larger than the 3.8% and 6.9% averages seen in gold’s other major seasonal rallies in spring and autumn. That makes late October one of the best times of the year to deploy capital into gold. That Western holiday gold-jewelry buying fuels such outsized demand that November has long proved one of gold’s best months of the year with average bull-year gains of 3.1%.
While this bullish gold seasonality really moderates in December with an average 0.6% bull-year gain, it soon accelerates again in January on that surplus-income gold investment buying. The 2.9% average gain gold enjoyed in January during those bull years between 2001 to 2012 and 2016 makes for this metal’s third best month of the calendar year. This winter-rally span is when gold enjoys peak seasonal tailwinds.
Unfortunately the great majority of speculators and investors remain wary of deploying into gold to ride its strong seasonal winter rally. Just like the last couple years, traders are worried about the Fed’s next rate hike once again very likely in mid-December. Gold-futures speculators in particular have spent recent years fooling themselves into believing Fed rates hikes are gold’s mortal nemesis, despite history proving that totally false.
The record is crystal-clear, gold actually thrives during Fed-rate-hike cycles! Before today’s there have been 11 since 1971, and gold has averaged impressive 26.9% gains across the exact spans of all these Fed-rate-hike cycles. In the majority 6 of these where gold actually rallied, its average gains were a staggering 61.0%! In the other 5 where gold retreated, its average losses were an asymmetrically-small 13.9%.
Gold blasted higher during Fed-rate-hike cycles when they started with gold relatively low, and unfolded at a gradual pace. Gold not only entered today’s 12th modern rate-hike cycle at major secular lows, but the Fed has never been slower in raising rates. Gold is still up 20.2% cycle-to-date since the day before the Fed finally started hiking again in December 2015. Fed rate hikes are bullish for gold, contrary to the myths.
During its last rate-hike cycle between June 2004 to June 2006, the FOMC hiked at 17 consecutive meetings for a total of 425 basis points! That more than quintupled the federal-funds rate to 5.25%, an inconceivably-high level today. Even though that was a very-aggressive rate-hike cycle, gold still managed to power 49.6% higher over that exact span! Rate hikes are no threat to gold’s strong winter seasonals.
Meanwhile investors remain distracted by this past year’s absurd Trumphoria rally, which is retarding gold investment demand. When stock markets melt up to endless record highs drenched in stellar complacency, investors aren’t interested in prudently diversifying into gold. Since gold tends to move counter to stock markets, investment demand surges when stocks weaken. A stock correction ignited this young gold bull.
As the Fed’s surreal stock-market levitation cracked in early 2016, American stock investors flocked to gold via shares in the flagship GLD SPDR Gold Shares gold ETF. When they buy its shares faster than gold itself is being bought, this ETF’s managers must issue sufficient new shares to offset all this excess demand and maintain gold tracking. The proceeds from these GLD-share sales are then used to buy gold bullion.
Thus GLD holdings builds show stock-market capital migrating into gold. In 2016 massive differential GLD-share buying drove a 28.0% or 179.8 metric-ton holdings build, helping drive gold 8.5% higher. But year-to-date in 2017, GLD’s holdings are only up 3.3% or 27.4t. Despite that gold is still impressively up 10.9% YTD, but it will surge dramatically when investment demand returns as these euphoric stock markets roll over.
That day of reckoning is inevitable. Back in late September the Fed finally started unwinding its trillions of dollars of quantitative easing that levitated stock markets for years. Quantitative tightening has never before been attempted, and it is exceedingly ominous for QE-inflated stock markets. While QT is starting small, it will ramp up to a $50b-per-month pace in Q4’18. That accelerating QT juggernaut will strangle stocks.
When these lofty Trumphoria-fueled stock markets finally mean revert, investors’ capital will flood back into gold for prudent portfolio diversification. If that happens in the coming months, it will really amplify gold’s strong winter seasonals. But gold’s biggest seasonal rally doesn’t need to be kick started by flight capital from bubble-valued stock markets. All that’s necessary is November’s usual outsized gold-jewelry demand.
So neither speculators’ Fed-rate-hike fears nor investors’ current apathy towards gold thanks to record stock markets are likely to short circuit gold’s strong winter rally this year. And if gold’s bull-market seasonals again prevail, that’s super-bullish for gold stocks in the coming months! They also enjoy strong winter seasonals thanks to gold’s, because gold miners’ profitability and thus stock prices leverage gold’s price action.
This next chart applies this same bull-market-seasonality methodology to the leading benchmark HUI NYSE Arca Gold BUGS Index. Naturally gold-stock seasonals closely mirror gold’s, so the miners too are also just entering their strongest seasonal rally of the year. On average in those last bull-market years from 2001 to 2012 and 2016, the HUI powered a big 15.4% higher between late October and late February!
Gold stocks’ strong 15.4% average winter rally bests their 14.0% and 11.2% rallies heading into spring and autumn. On average gold stocks’ major seasonal bottoming heading into their winter rally arrives on October’s 19th trading day, which translated into October 26th this year. Like their primary driver gold, gold stocks tend to rally strongly in November, moderate in December, and then surge again in January and February.
And given the sentimental, technical, and fundamental setups for gold stocks entering this year’s winter rally, the usual seasonal tailwinds are likely to help propel them much farther than usual. Just like gold and because of it, gold stocks entered a mighty new bull market early in 2016 as well. Between mid-January and early August last year, the HUI soared 182.2% higher in just 6.5 months! It was a wildly-profitable run.
That left the red-hot gold stocks very overbought last summer, then they got sucked into gold’s correction. Just like gold, their correction ballooned to monstrous proportions thanks to that post-election Trumphoria stock rally’s impact on gold investment demand. At worst the HUI plunged 42.5% in 4.4 months, a brutal drop. But ever since then gold stocks consolidated sideways on balance, recently seeing major upside breakouts.
But after surging 8.4% in August, the very next month the gold stocks were whacked back down 7.5% in sympathy with gold. Gold-futures speculators fled as futures-implied Fed-rate-hike odds at its upcoming mid-December meeting skyrocketed from 32% to 83% in less than three weeks! So the HUI spent late September and much of October languishing under 200, low technical levels breeding bearish sentiment.
The gold stocks are now entering their seasonally-strongest time of the year deeply out of favor at weak prices. These are powerful buy signals within ongoing bull markets, really upping the odds this year’s new winter rally will prove exceptionally large. Bullish sentiment and technicals really amplify the usual seasonal tailwinds. Even better, the gold miners’ fundamentals are all lined up to drive major gains in coming months.
Every quarter I analyze the operating performances of the top individual gold miners’ stocks included in the leading gold miners’ ETFs. These of course are the GDX VanEck Vectors Gold Miners ETF for the larger majors, and its sister GDXJ VanEck Vectors Junior Gold Miners ETF for the smaller juniors. The gold miners are now in the midst of reporting their Q3’17 earnings season, which should end up being impressive.
As always I’ll write comprehensive essays analyzing the latest quarterly results from the top GDX and GDXJ components once they finish reporting in mid-November. But a few weeks ago I gave a preview of what they are likely to collectively report based on average gold prices and Q3 seasonals in production and costs. Crunching the numbers for GDX yields big potential Q3’17 quarter-on-quarter profits growth around 14%!
Thus as the rest of the gold miners report their Q3’17 results by mid-November, there will likely be plenty of upside surprises. That includes higher production, lower costs, and better full-year-2017 guidance for the gold miners than today’s bearish traders expect. So good fundamentals could supercharge this first month of gold stocks’ winter rally this year. Improving fundamentals aligning with seasonals portends big upside!
If the gold stocks were entering this winter-rally period drenched in greed after a major upleg, seasonal tailwinds probably couldn’t overcome the healthy correction tendency. If the gold miners’ fundamentals were deteriorating, that would likely prove too much heavy lifting for seasonals. But with the strong winter-rally seasonals synchronizing with very bullish technicals, sentiment, and fundamentals, gold stocks should surge.
This last chart breaks down gold-stock seasonality into more-granular monthly form. Each calendar month between 2001 to 2012 and 2016 is individually indexed to 100 as of the previous month’s final close, then all like calendar months’ indexes are averaged together. While this November-to-February winter-rally period doesn’t encompass most of gold stocks’ strongest months, it does enjoy the most-consistent gains.
On average in bull-market years, November enjoys the fifth-best gold-stock gains of the calendar year at 4.6% in HUI terms. That’s not far off August’s and September’s average bull-market-year rallies of 4.7% and 4.8%, weighing in at fourth and third. May is better yet, ranking second at 5.3%. But gold stocks’ second-, third-, and fourth-best months are largely surrounded by flat or lower months offsetting those big gains.
That’s not the case during gold stocks’ winter-rally months, where the solid-gains streak persists for the whole time. November’s 4.6% average gains are followed by December’s respectable 2.3%, January’s accelerating 3.1%, and February’s massive first-place 6.2%! This unbroken winter-rally streak is what makes this period between late October and late February the best time of the year to be heavily long gold stocks.
There is no other seasonal streak with such unparalleled consistency of big gold-stock gains. Since they continue to march higher on balance throughout their winter-rally span, it yields the best seasonal gains of the calendar year. The rest of the year’s two-steps-higher-one-step-back action just doesn’t happen during the winter on average. There are no significant gold-stock selloffs in this amazing winter-rally span!
Of course the standard seasonality caveat applies that these are mere tendencies, not primary drivers of gold or gold stocks. Seasonal tailwinds can be easily drowned out by bearish sentiment, technicals, and fundamentals. Seasonality doesn’t always work, especially when it doesn’t align with the primary drivers of sentiment, technicals, or fundamentals in that order. Thankfully that certainly isn’t the case this year.
The gold miners’ stocks aren’t heading into November at overbought levels following a major upleg, thus sentiment is quite bearish. And with the HUI up just 2.2% YTD compared to gold’s 10.9% gains, the gold stocks are far underperforming the dominant driver of their earnings. Their big profits leverage usually translates into upside running 2x to 3x gold’s, so they are overdue to mean revert much higher to normalize.
And the gold miners’ fundamentals look excellent heading into this seasonally-strongest span, with big sector-wide sequential profits growth likely to come in around 14% in their latest Q3’17 results. That will probably generate plenty of exciting upside surprises for traders who’ve largely abandoned gold stocks this year. Add in a major gold upleg fueled by stock markets rolling over, and this winter rally ought to be huge.
The greatest gains in this coming winter rally won’t be won in the popular ETFs like GDX and GDXJ, as they are far-overdiversified and burdened with way too many under-performing gold miners. So it’s much more prudent to deploy capital in the best individual gold miners with superior fundamentals. Their gains will handily trounce the ETFs, further amplifying the already-huge upside potential of this sector as a whole.
The key to riding any gold-stock bull to multiplying your fortune is staying informed, both about broader markets and individual stocks. That’s long been our specialty at Zeal. My decades of experience both intensely studying the markets and actively trading them as a contrarian is priceless and impossible to replicate. I share my vast experience, knowledge, wisdom, and ongoing research through our popular newsletters.
Published weekly and monthly, they explain what’s going on in the markets, why, and how to trade them with specific stocks. They are a great way to stay abreast, easy to read and affordable. Walking the contrarian walk is very profitable. As of the end of Q3, we’ve recommended and realized 967 newsletter stock trades since 2001. Their average annualized realized gain including all losers is +19.9%! That’s hard to beat over such a long span. Subscribe today and get invested before gold stocks power way higher!
The bottom line is gold stocks are just entering their seasonally-strongest period of the year. Their big winter rally is fueled by gold’s own, which is driven first by outsized demand from holiday jewelry buying and later new-year investment buying. So both the metal and its miners’ stocks have strong tendencies to rally between late October and late February in bull-market years. It’s the best calendar span to own gold stocks.
And this year’s coming winter rally looks exceptionally bullish because the seasonal tailwinds won’t be overpowered by bearish sentiment, technicals, or fundamentals. All of these primary drivers are bullish today and closely aligned with the strong seasonals, making for a powerful united force to propel gold stocks dramatically higher. Speculators and investors alike should be fully deployed for the coming months.
Adam Hamilton, CPA
November 3, 2017
Copyright 2000 – 2017 Zeal LLC (www.ZealLLC.com)

The gold stocks are off to the races again, with big gains mounting. They just staged major breakouts, shattering a vexing consolidation that had trapped them for an entire year. Such momentum early in gold’s strong season is a very-bullish portent. As higher prices improve both technicals and sentiment, buying begets more buying. With gold-stock prices still quite low in secular terms, their upside remains huge.
Gold stocks are a small contrarian sector without a wide following. So their latest surge has surprised many investors and speculators. But it shouldn’t have. In the markets knowledge is profits, so staying informed about gold stocks’ fundamentals, technicals, and sentiment is crucial. The traders who did their homework this summer and bought in low when few others were willing are now sitting on fat unrealized gains.
Nearly every summer like clockwork, gold stocks slump to a summer-doldrums low. Gold miners’ profits and hence ultimately stock prices are driven by prevailing gold prices. And gold investment demand has always tended to slump seasonally in summers. On July 7th, the flagship HUI NYSE Arca Gold BUGS Index, which is closely mirrored by the leading GDX VanEck Vectors Gold Miners ETF, hit a demoralizing low of 178.9.
The gold-stock sector was down 1.9% YTD in a year where gold had rallied 5.4% over that span. That very day, I published an essay titled Gold Stocks’ Summer Bottom. I explained why summer gold-stock weakness is a great buying opportunity, concluding “So smart contrarians willing to fight the herd to deploy when it’s unpopular are subsequently richly rewarded when gold stocks’ seasonal rallies march much higher.”
From that typical summer-doldrums low, the HUI has already surged 21.7% higher as of this week! But sadly not many traders rode that whole rally, as most people hate buying low. In early August when just a third of gold stocks’ recent rally had happened, I wrote another essay explaining gold stocks’ bullish autumn seasonals. This sector has always tended to rally sharply with gold from summer lows into late September.
A week later when less than half of gold stocks’ latest surge was accomplished, I dug into their technicals to illustrate why this sector was a coiled spring. The gold stocks had just peeked their heads above their key 200-day moving average, and major breakouts were imminent. Now a month later they have indeed come to pass just as expected. These big breakouts were highly probable, leading to big profits for the informed.
Now it’s important for all investors and speculators to understand these major breakouts’ significance and implications going forward. Such events are very bullish, happening early in major new uplegs. This first chart looks at HUI technicals since early 2016, when a new bull market in gold stocks was birthed out of extreme secular lows. Today’s breakouts are the biggest and most important since February 2016, super-bullish.
Back in mid-January 2016, the gold stocks were universally despised and bearishness was off the charts. They were battered to fundamentally-absurd 13.5-year secular lows, trading at levels last seen when gold was near $305. Yet it was actually 3.6x higher at $1087! Gold-stock prices couldn’t stay radically disconnected from their underlying earnings fundamentals forever, thus that incredible anomaly couldn’t last.
So gold stocks reversed hard and took off like rockets, blasting the HUI 182.2% higher in just 6.5 months! That certainly left them very overbought last summer, which I warned about at the time. So they started correcting, which is perfectly normal in all bull markets. But that healthy correction snowballed to truly monstrous proportions thanks to another epic anomaly. Trump’s surprise election victory indirectly crushed gold.
Gold investment is so important in all portfolios because gold tends to move counter to stock markets, which is rare. Gold is effectively the anti-stock trade, the ultimate portfolio diversifier. So the incredible Trumphoria stock-market surge in the election’s wake decimated gold investment demand. That dragged the gold stocks far lower than they deserved to be fundamentally. The HUI plunged 42.5% in 4.4 months.
That left this small sector seriously out of favor as 2016 wrapped up, which was ridiculous. Despite an ugly Q4, the HUI still blasted 64.0% higher last year! Gold stocks were the best-performing sector in all the stock markets, yet traders foolishly shunned them. That irrational hyper-bearish sentiment in the wake of the post-election gold rout bled into 2017. That trapped the gold stocks in a vexing consolidation.
It is readily evident in this chart, the triangle pattern running for an entire year until recent weeks. The gold stocks enjoyed some big rallies with gold, but they sequentially failed at lower highs. That really spooked technically-oriented traders. But the action wasn’t wholesale bearish, as the gold stocks per the HUI were generally carving higher lows as well. The result was this massive triangle consolidation pattern.
Unfortunately there wasn’t much hope of a breakout during the summer. Gold’s summer doldrums lead to parallel sideways action in gold stocks in most summers. For gold-stock investors, summers are just something to be endured. They usually end up being barren sentiment wastelands where traders give up on this sector entirely. So material gold-stock gains in summers are rare, they can’t be expected in any year.
The HUI drifted 3.5% lower in June, really damaging sentiment. This was much weaker than normal in early summers, as the HUI saw average gains of 1.2% in Junes in the modern bull-market years of 2001 to 2012 and 2016. Even the HUI’s 5.6% rebound in July, far better than its 0.7% average losses, wasn’t enough to restore sentiment. So the gold stocks generally drifted lower this summer within that same triangle.
Interestingly the upper resistance line of that big chart pattern closely paralleled the HUI’s important 200-day moving average. Chart patterns like this triangle consolidation are subjective, they can be drawn in different ways. So while the general resistance line was evident to all technically-oriented traders, the timing on a breakout wouldn’t be universally recognized. But 200dmas are hard mathematical constructs.
200dmas are the most-important and widely-followed technical lines in all the markets. They smooth out the daily volatility to highlight long-term trends. Prices below their 200dmas are often considered to be in bear markets, leaving traders expecting further weakness. But once prices forge decisively above their 200dmas, traders assume they are reentering bulls. That generates bullish psychology which fuels buying.
The HUI first started flirting with its 200dma again in late July. But it wasn’t until mid-August when it started to break out decisively, closing more than 1% above that key level. And those gains weren’t solidified until late August, when traders started to realize this 200dma breakout was the real deal and not a head fake. That 200dma breakout in recent weeks is the most important of the new major gold-stock breakouts.
But because the upper resistance line of that vexing triangle consolidation paralleled the HUI’s 200dma, a simultaneous breakout from that chart pattern happened. Gold stocks have not rocketed above their bull-bear-psychology-dividing 200dma, or broken a major downtrend resistance line like this, since February 2016. And that was early in a monster upleg where this sector would nearly triple in just over a half-year!
Major breakouts are so darned bullish because they soon become self-feeding. The great majority of investors and speculators aren’t contrarians, they lack the discipline and toughness to fight popular fear and buy low. Instead most prefer chasing momentum, buying where gains are already happening. So breakouts quickly shift sentiment to bullish which drives a lot more buying. And that buying expands the breakouts.
In all markets, buying begets buying. The faster prices rise, the more traders want to buy in to ride the momentum. The more traders buy in, the faster prices rise. Major breakouts kindle this virtuous circle of buying, leading to big and growing capital inflows. Everyone loves winners, and these major gold-stock breakouts are leading to the best gains in the entire stock markets. Traders are increasingly taking notice.
All this gold-stock buying in recent weeks is just now triggering the most-important technical buy signal of all, the fabled Golden Cross! Golden Crosses are one of the most-powerful and most-widely-followed signals of new bull markets. They happen coming out of lows as a 50dma crosses back above a 200dma. As the white and black lines in this chart show, the first Golden Cross since early 2016 is triggering right now.
That last Golden Cross in February 2016 led to months on end of big capital inflows into the beaten-down gold stocks. This week’s second Golden Cross ought to lead to a similar outcome. Recent weeks’ major breakouts have just flashed an irresistible major buy signal to technically-oriented traders. Whether this is the second major upleg of last year’s bull or an entirely new bull, gold stocks are early in a major rally higher.
Their upside from here remains huge. That short-term chart above makes it appear like gold-stock prices are getting to the high side, but nothing could be farther from the truth. This next chart zooms out to the massive gold-stock bear that started in late 2011. The small shaded zone in the lower right is the entire area of the first chart. After a brutal secular bear persisting for years, gold stocks’ bull remains little and young.
Between September 2011 and January 2016, the gold stocks as measured by their flagship HUI index plunged a breathtaking 84.1% in 4.4 years! That colossal bear was driven by an extreme anomaly. The Fed’s radically-unprecedented open-ended QE3 campaign levitated the US stock markets, slaughtering demand for alternative investments led by gold. The gold stocks plummeted on massive gold dumping.
They finally bottomed in epic despair early last year, heralding a new bull market. It soon staged major breakouts from two separate bear-market resistance lines, which are rendered here. That young gold-stock bull rocketed higher, leading to that near-triple in about a half-year. But despite those wicked-fast gains, the gold stocks merely hit a 3.2-year high. At best they were only back to mid-2013 deep-bear levels.
Even after these major breakouts of recent weeks, the gold-stock sector is still languishing way down at late-bear levels from late 2014. Bull markets after exceptional bears usually see prices at least revisit the previous bull’s top, which was 635.0 on the HUI in September 2011. That implies huge upside of 196% remains from even this week’s levels. What other sector in these overvalued stock markets has tripling potential?
But if fundamentals are strong enough after exceptional bears to support symmetrical bull markets, those tend to ultimately drive prices to new all-time record highs. I strongly suspect gold stocks’ current bull will run for years, eventually pushing the HUI above its previous peak. That would take a total gold-stock bull of just 531% from gold stocks’ deep 13.5-year secular low in January 2016. That’s nothing by this sector’s standards.
During gold stocks’ last secular bull from November 2000 to September 2011, the HUI skyrocketed an epic 1664% higher! That made early contrarian investors including our subscribers rich. We only need to see a bull a third as large to propel the HUI back to new all-time record highs. And the gold miners’ fundamentals already support secular-bull-level gains, as evidenced by their latest quarterly results just reported.
Gold-mining profitability is simply the difference between prevailing gold prices and operating costs. In Q2’17, the elite gold miners of that leading GDX gold-stock ETF reported average all-in sustaining costs of just $867 per ounce. That was already $391 below Q2’s average gold price, pure profit. And at this week’s higher $1339 gold levels, those major-gold-mining profits have already ballooned to a hefty $472!
The smaller mid-tier gold miners of the related GDXJ junior-gold-stock ETF looked nearly as good in Q2, with average AISC of $879. That implies big profitability of $460 per ounce at this week’s gold prices. These fat margins coupled with the low gold-stock prices have left many gold miners trading at low price-to-earnings ratios today. This sector is wildly undervalued fundamentally, supporting a new secular bull market.
Thus odds are the major gold-stock breakouts in recent weeks are merely the beginning of a massive new gold-stock upleg. As gold stocks keep powering higher, more and more investors and speculators will want to buy in to chase those gains. Their capital inflows will push this small sector higher still, widening its circle of appeal to even more traders. Once gold stocks finally get moving, they tend to run for a long time.
Since most traders inexplicably choose to be uninformed, the bullish implications of these major gold-stock breakouts still aren’t widely known. So it’s certainly not too late to buy in, even though big gains have already been won since summer. Gold stocks’ strong season tends to run from now until next spring, driven by gold’s own strong season. The gold stocks will likely be considerably higher by year-end.
This young new upleg should get supercharged as gold investment demand surges when the stock markets inevitably roll over. With the Fed on the verge of starting to reverse its quantitative easing that levitated stock markets for years with ominous quantitative tightening, that long-overdue major stock-market selloff is likely sooner rather than later. As gold is bid higher on weaker stocks, gold stocks will soar.
The greatest gains in this young gold-stock upleg won’t be won in the popular ETFs like GDX and GDXJ, as they are far-overdiversified and burdened with way too many under-performing gold miners. So it’s much more prudent to deploy capital in the best individual gold miners with superior fundamentals. Their gains will handily trounce the ETFs, further amplifying the already-huge upside potential of this sector as a whole.
The key to riding any gold-stock bull to multiplying your fortune is staying informed, both about broader markets and individual stocks. That’s long been our specialty at Zeal. My decades of experience both intensely studying the markets and actively trading them as a contrarian is priceless and impossible to replicate. I share my vast experience, knowledge, wisdom, and ongoing research in our popular newsletters.
Published weekly and monthly, they explain what’s going on in the markets, why, and how to trade them with specific stocks. They are a great way to stay abreast, inexpensive and easy to read. Walking the contrarian walk is very profitable. As of the end of Q2, we’ve recommended and realized 951 newsletter stock trades since 2001. Their average annualized realized gains including all losers is +21.2%! That’s hard to beat over such a long span. We currently have unrealized gains on our trading books as high as +159%. Subscribe today and get invested before gold stocks really start running!
The bottom line is gold stocks just enjoyed two parallel major breakouts in recent weeks. They shattered a vexing consolidation that’s trapped them for a year, and more importantly burst back above their critical 200dma. The resulting quickly-improving technicals are rapidly shifting sentiment back to bullish, driving more buying as traders return. Since buying begets buying, major gold-stock uplegs soon become self-feeding.
But since this small contrarian sector is largely ignored, most investors and speculators don’t yet realize how bullish these major breakouts are. Despite their big gains since early 2016, the gold stocks remain very low and their young bull is still little in secular context. So it’s not too late to get deployed. With gold itself likely to rally far higher as these lofty stock markets roll over, gold stocks’ upside potential is huge.
Adam Hamilton, CPA
September 8, 2017
Copyright 2000 – 2017 Zeal LLC (www.ZealLLC.com)
The gold miners’ stocks have largely ground sideways this year, really lagging gold’s strong rally. That lack of upside has decimated sentiment, leaving a bearish wasteland bereft of hope. But this deeply-out-of-favor sector is actually a coiled spring, ready to surge dramatically as psychology shifts. Sentiment, technicals, and fundamentals all point to much-higher gold-stock prices even at today’s prevailing gold levels.
The main appeal of gold-mining stocks is their underlying profits’ leverage to gold. The gold stocks are much riskier than gold, due to many operational, geological, and geopolitical risks the metal itself doesn’t share. So investors and speculators alike must be compensated for these big added risks with superior returns to gold. That hasn’t happened so far in 2017, which is why gold stocks are so widely despised today.
All year long, the extreme Trumphoria-fueled stock-market rally has stolen the limelight. The flagship S&P 500 stock index is up 10.5% year-to-date as of this week. That’s sucked all the oxygen out of the investment world, overshadowing everything else. So investors have shunned gold this year, while the futures speculators have shorted it at near-record extremes. Gold has often been mocked on CNBC all year.
That’s pretty ironic though, as gold’s YTD performance is +10.9%! That’s a little better than the general stock markets. That should be enough to garner some attention, but gold can’t escape from the stock markets’ eclipsing shadow. Gold miners’ inherent profits leverage to gold usually enables their stock prices to amplify an underlying gold rally by 2x to 3x. Thus the gold-stock sector ought to be up 20% to 30% YTD.
The dominant gold-stock index is the HUI NYSE Arca Gold BUGS Index, which is closely mirrored by the leading GDX VanEck Vectors Gold Miners ETF. So far in 2017, its performance has been dismal relative to gold. As of this week the HUI was only up 6.6% YTD! That makes for mere 0.6x leverage to gold, unacceptable given gold stocks’ big additional risks. That’s why psychology is exceedingly bearish today.
Gold stocks are underperforming so massively this year due to sentiment. Because this small contrarian sector is languishing, traders want nothing to do with it. And because they are widely avoided, the gold stocks are trapped in consolidation hell. The only thing able to start shifting sentiment back to bullish is a meaningful gold rally igniting material gold-stock buying. The resulting gains would win back capital inflows.
Sentiment and technicals are inexorably intertwined. No matter what else is going on, when stocks are high traders get excited and bullish. That’s happening in the general stock markets today, despite their bubble valuations and the Fed’s quantitative tightening ominously looming. But when stocks are down, traders wax sullen and bearish. The markets work this way universally, the gold stocks are no exception.
As at all sentiment extremes, traders have assumed this vexing gold-stock weakness will last indefinitely. But that’s a bad bet, as sentiment perpetually meanders back and forth between excessive greed and fear. The longer sentiment stays on one side of that arc, and the more extreme it gets, the greater the odds for an imminent mean-reversion swing back the other way. And those tend to overshoot proportionally.
The last time gold stocks drifted near lows like so far this year was in the second half of 2015. They were hated, with nearly everyone predicting they were doomed to spiral lower forever. Yet sentiment shifted out of that bearish echo chamber, and the gold stocks took off like North Korean ICBMs. In merely 6.5 months, the HUI skyrocketed 182.2% higher! That amplified gold’s 25.2% concurrent rally by a breathtaking 7.2x.
Gold stocks have long exhibited a drift-surge pattern. Long consolidations bleeding away all bullishness are soon followed by massive uplegs. They ignite just as traders are capitulating and walking away. The best time to buy is late in one of these grating drifts, because the next major upleg is just around the corner. And that’s exactly where the gold stocks are today technically, as this HUI consolidation chart reveals.

Last year’s monster gold-stock upleg that has already been forgotten is crystal-clear here. Contrarians willing to fight the herd and buy low in late 2015 when gold stocks were shunned made out like bandits. They nearly tripled their capital in about a half-year! Once this sector starts moving, shifting from drift to surge, its resulting uplegs tend to be massive. The trick is bucking bearish sentiment to get invested early.
That enormous upleg birthing a new gold-stock bull last year was followed by a gigantic drop driven by gold. Since prevailing gold prices directly drive their earnings, the gold stocks follow and amplify moves in the metal they mine. In the second half of 2016, gold plunged sharply thanks to a highly-improbable series of events. Gold’s resulting freakish drop was incredibly anomalous, which is why it bounced back this year.
First gold was hit by gold-futures stop losses being run, then by the Trumphoria stock-market surge in the wake of the surprise election results, and finally by the Fed’s second rate hike of this cycle. Seeing an isolated event-driven selloff isn’t unusual, but three in a row back-to-back is unheard of. I explained all of them in depth in past essays if you want a deeper understanding of why they were unrepeatable one-off events.
Gold fell 17.3% in 5.3 months, certainly a massive correction but well shy of new-bear-market territory at -20%. Gold stocks as measured by the HUI amplified gold’s downside by 2.5x, smack in the middle of that historical 2x-to-3x leverage range. So the huge gold-stock selloff in last year’s second half wasn’t outsized at all compared to the anomalous carnage in gold. That’s the way this sector has always worked.
Once again gold miners’ profits leverage to gold explains their price action. Consider an example, a gold miner producing gold at all-in sustaining costs of $1000 per ounce. At $1250 gold, that yields profits of $250 per ounce. If gold rallies or falls 10% to $1375 or $1125, this miner’s profits literally soar or plunge 50% to $375 or $125 per ounce! The higher any miner’s costs, the greater its profits leverage to gold prices.
In the last quarter fully reported, Q1’17, the major gold miners of GDX reported average all-in sustaining costs of $878. Q2’17 results haven’t been fully released yet, but should be by next week. At $878 AISC, $1250 gold yields profits of $372 per ounce. If gold rallies or falls 10%, these per-ounce profits change to $497 or $247. That’s up or down 34% on a 10% gold move! That’s where gold stocks’ leverage to gold comes from.
So seeing this sector largely drift sideways this year despite gold’s strong 10.9% YTD gain is anomalous, it shouldn’t have happened. And it wouldn’t have happened without stock markets’ extreme Trumphoria rally monopolizing traders’ attention. They’ve been so captivated that they’ve ignored gold’s superior gains in 2017, and that lack of interest has slaughtered the gold stocks dependent on gold being in favor.
The result technically is the major triangle consolidation rendered above. Since gold stocks’ deep low in December on a Fed rate hike, their lower support has been slowly climbing. But meanwhile their upper resistance has been trending lower. This has slowly and inexorably compressed this sector technically, tightening the gold stocks into a coiled spring. These converging trendlines guarantee an imminent breakout.
And odds overwhelmingly favor an upside resolution to this triangle consolidation pattern. Gold stocks’ resistance line is paralleling their key 200-day moving average. A decisive move above their 200dma will unleash all kinds of buying from technically-oriented traders. And that 200dma breakout will result in the simultaneous breakout from this year’s vexing consolidation. That will rapidly shift psychology away from bearish.
There are two major reasons why gold stocks are heading much higher rather than lower soon. Gold has long enjoyed a major autumn rally which tends to catapult the gold stocks higher in the coming months. I wrote about this in depth last week, explaining why it happens and quantifying it. With gold seasonals so strong in the coming months, it would be super-unlikely for gold stocks to break down from already-low levels.
On average in bull-market years, gold powers 6.9% higher between mid-June and late September. That fuels an 11.2% HUI rally on average in that same general timeframe. As gold continues powering higher over the next month, the gold stocks will almost certainly amplify its gains. This isn’t an academic point, as this year’s autumn rally is already well underway. Gold’s summer-doldrums low came in early July.
Since then gold and the HUI have climbed 5.2% and 8.6% higher as of this week. That resulting 1.7x leverage is still on the low side, but rapidly improving from the 0.6x year-to-date metric. Gold stocks are starting to outperform their profits-driving metal again, a major sign sentiment is already shifting away from extreme bearishness. But there’s a far-better reason to be bullish on gold stocks than their autumn rally.
While these coiled-spring technicals are exciting, they pale in comparison to the immense fundamental disconnect between gold-miner stock prices and gold levels. Ultimately all stock prices eventually reflect some reasonable multiple of their underlying corporate profits. But the gold stocks are now collectively trading as if gold was far under current prices, which is supremely irrational. This anomaly has to mean revert.
This last chart offers the most-compelling fundamental justification to be heavily long gold stocks today. It looks at a construct called the HUI/Gold Ratio, calculated simply by dividing the daily HUI close by the daily gold close. This HGR acts as a proxy for that core fundamental relationship between gold, miners’ profits, and their stock prices. Gold stocks have rarely been as undervalued relative to gold as they are now.

This week, the HGR was trading near 0.152x. The HUI was running at 15.2% of gold’s price. Of course like all indicators that means nothing in isolation. But the context provided by this long-term HGR chart shows how absurdly cheap the gold stocks remain relative to the metal which drives their earnings. The only year in modern history where gold stocks were cheaper was 2015, the end of an exceptional secular bear.
Early in 2016 gold stocks as measured by the HUI slumped to a fundamentally-absurd 13.5-year secular low. It made no sense whatsoever. Though gold was trading near $1087, way above this industry’s all-in sustaining costs, the HUI was trading at levels last seen when gold was near $305 in July 2002! That anomaly couldn’t and didn’t last, resulting in battered gold stocks nearly tripling in only about a half-year.
That coiled-spring reaction perfectly illustrates how explosive gold-stock upside is after this sector suffers a long, low drift resulting in extremely-bearish psychology. If today’s 0.15x HGR is actually righteous, it would’ve been seen plenty of times in modern history. But it hasn’t. Such extremely-low gold-stock price levels relative to gold were only able to persist briefly after a long secular bear. They weren’t sustainable.
Remember the Fed started aggressively levitating the US stock markets in early 2013, wreaking havoc on alternative investments led by gold. The gold market’s last normal years were sandwiched between 2008’s stock panic and 2013’s radical Fed distortions. That’s the best recent baseline for where the HGR ought to trade. And between 2009 to 2012, it was running way up at 0.346x. That’s over double today’s levels!
To simply mean revert back up to those last normal levels relative to gold, the big gold stocks dominating the HUI would have to power 127% higher from here to 441! To restore some semblance of normalcy fundamentally, the gold stocks need to more than double from here even at this week’s $1276 prevailing gold levels! The gold stocks certainly can’t stay disconnected from their own earnings realities forever.
All markets are cyclical, including gold stocks. Extreme undervaluations relative to gold are followed by overvaluations as the pendulum swings back the other way. Mean reversions after extremes never stop in the middle. Their momentum leads them to overshoot to the opposite extreme! That makes gold stocks’ coming upside far more impressive. A proportional overshoot heralds radically-higher gold-stock prices ahead.
At worst in mid-January 2016, the HGR fell to an all-time low of 0.093x. That was a staggering 0.253x under that post-panic normal-year average HGR of 0.346x. So a proportional overshoot would briefly boost the HGR 0.253x above that mean, to 0.599x. That upside extreme wouldn’t last long, as greed wouldn’t be sustainable. But it could happen in a blowoff top after gold stocks are popular following a bull.
At $1276 gold, that yields a potential HUI topping target of 764! That’s a stupendous 293% above this week’s levels. Is there any other stock sector with the potential to quadruple in the coming years? No way. Gold stocks are the only severely-undervalued sector left after this Trumphoria stock rally, so their upside is unparalleled. And incredibly these simple HGR-derived gold-stock targets are actually conservative.
They assume gold is static, stuck at $1276. That’s exceedingly unlikely. As these Fed-levitated stock markets inevitably roll over with Fed quantitative tightening dawning, gold itself will catch a major bid as investment capital returns. As a rare asset that generally moves counter to stock markets, gold is hostage to them. So when the stock markets suffer their long-overdue major selloff, gold will soar on capital inflows.
10%, 20%, and 30% gold uplegs from here would take this metal to $1403, $1531, and $1658. Plug in the HGR of your choice, the post-panic average or the mean-reversion overshoot, and you get some potential HUI targets so high they defy belief. And don’t think a 30% gold rally is out of the question. In response to the last stock-market correction, gold powered 29.9% higher in just 6.7 months in early 2016!
Don’t get bogged down in HUI upside targets, they only serve to illustrate a critical point for investors and speculators today. Gold stocks are not only radically undervalued at today’s gold prices, but even more so compared to where gold is heading in its own still-very-much-alive bull market. Even if you think gold stocks only have 50% to 100% upside, that’s vastly better than everything else in these overvalued stock markets.
Gold stocks’ leverage to gold’s gains is already accelerating in their early autumn rally. That is gradually starting to shift sentiment, pushing that pendulum away from being pegged at hyper-bearish. The more gold stocks rally, the more traders will take notice and deploy capital. That process will soon become self-feeding, and gold stocks will be off to the races again like in early 2016. That will yield massive gains.
That begs the question what are you going to do about it? Are you tough enough mentally to invest like a contrarian, to buy low and out of favor when few others are willing? Can you handle fighting the crowd, making unpopular investments? Or will you take the mainstream approach, which is waiting to buy gold stocks until they’ve already doubled from here? The biggest gains are won by the early birds who buy the lowest.
While investors and speculators alike can certainly play gold stocks’ coming breakout rally with the major ETFs like GDX, the best gains by far will be won in individual gold stocks with superior fundamentals. Their upside will trounce the ETFs’, which are burdened by over-diversification and underperforming gold stocks. A carefully-handpicked portfolio of elite gold and silver miners will generate much-greater wealth creation.
At Zeal we’ve literally spent tens of thousands of hours researching individual gold stocks and markets, so we can better decide what to trade and when. As of the end of Q2, this has resulted in 951 stock trades recommended in real-time to our newsletter subscribers since 2001. Fighting the crowd to buy low and sell high is very profitable, as all these trades averaged stellar annualized realized gains of +21.2%!
The key to this success is staying informed and being contrarian. That means buying low when others are scared, like late in this year’s vexing consolidation. An easy way to keep abreast is through our acclaimed weekly and monthly newsletters. They draw on our vast experience, knowledge, wisdom, and ongoing research to explain what’s going on in the markets, why, and how to trade them with specific stocks. For only $10 per issue, you can learn to think, trade, and thrive like contrarians. Subscribe today, and get deployed in the great gold and silver stocks in our full trading books!
The bottom line is gold stocks look like a coiled spring today despite the extreme bearishness plaguing them. Following its long drift so far this year, this sector is ready to stage a massive breakout surge in the coming months. Technically gold stocks’ triangle consolidation has nearly converged, guaranteeing an imminent breakout. But far more bullish are gold stocks’ deeply-undervalued fundamentals relative to gold.
Gold-mining profits are heavily dependent on prevailing gold prices. And with this industry’s costs way under gold’s current levels, the gold miners are already earning hefty profits today. Sooner or later their stock prices must reflect fundamental reality. That mean-reversion process is already underway, with gold stocks’ early-autumn-rally gains increasingly outpacing gold’s. Their upside leverage should only accelerate.
Adam Hamilton, CPA
August 11, 2017
Copyright 2000 – 2017 Zeal LLC (www.ZealLLC.com)
If you would like to receive our free newsletter via email, simply enter your email address below & click subscribe.
 Follow us on Twitter
 Become our facebook fan
CONNECT WITH US
Tweets
Tweet with hash tag #miningfeeds or @miningfeeds and your tweets will be displayed across this site.
MOST ACTIVE MINING STOCKS
Daily Gainers
 Lincoln Minerals Limited Lincoln Minerals Limited |
LML.AX | +125.00% |
| Golden Cross Resources Ltd. |
GCR.AX | +33.33% |
 Casa Minerals Inc. Casa Minerals Inc. |
CASA.V | +30.00% |
| Athena Resources Ltd. |
AHN.AX | +22.22% |
| Adavale Resources Limited |
ADD.AX | +22.22% |
| Azimut Exploration Inc. |
AZM.V | +21.98% |
| New Stratus Energy Inc. |
NSE.V | +21.05% |
| Dynasty Gold Corp. |
DYG.V | +18.42% |
| Azincourt Energy Corp. |
AAZ.V | +18.18% |
| Gladiator Resources Limited |
GLA.AX | +17.65% |